Tableau to Power BI Migration in 2026: Costs, Methodology, and the Translation-First Approach
The most common Tableau-to-Power-BI failure isn't technical. It's strategic: teams rebuild every dashboard from scratch in Power BI, the numbers drift from the old Tableau versions, and finance spends three months arguing about which one is "right." Six months later they're back on Tableau, except now they've also paid for a Power BI tenant and a failed migration project.
The teams that succeed do something different. They translate: every Tableau calculated field becomes a DAX measure with the same logic, every LOD expression becomes a CALCULATE pattern, and every dashboard is reconciled to the penny against its Tableau original before the business sees it. The output is the same Power BI environment everyone wanted — but the business never lost trust in its KPIs.
This guide is for the finance, RevOps, or analytics leader who's been told "we're moving off Tableau" and is now responsible for not breaking the reporting that runs the business. It covers the real 2026 cost ranges, the 4-phase methodology that protects parity, the LOD patterns that cause the most pain, and when hiring outside help actually pays back.
Why companies are moving from Tableau to Power BI in 2026
The cost story is the headline, but it's not the whole story.
License costs. Tableau Creator runs $75/user/month. Power BI Pro is $14/user/month, and most enterprises already get it bundled with Microsoft 365 E5 — making the marginal cost of a new viewer essentially zero. For a 100-seat deployment with 20 creators and 80 viewers, the all-in delta is roughly $30,000–$70,000 a year. Real, but rarely the deciding factor.
The Microsoft stack lock-in is the deciding factor. Most mid-market companies are already on Azure, Microsoft 365, and increasingly Microsoft Fabric. Power BI integrates natively with Entra ID for row-level security, with Azure SQL and Synapse for the data layer, with Teams for distribution, and with Copilot for natural-language queries. Tableau is the odd one out, and CIOs notice.
Salesforce ownership has reduced Tableau's enterprise momentum. Tableau hasn't shipped a comparable answer to Microsoft Fabric or Copilot. Renewal conversations now routinely include a 20–40% price increase, and enterprise procurement teams have started asking the obvious question.
The data layer matters more than the visualization tool. If you're modernizing your warehouse — moving to Snowflake, BigQuery, Azure SQL, or Fabric's OneLake — Power BI's semantic model fits more cleanly than Tableau's data-source-per-workbook approach. A migration is often a clean opportunity to also fix the upstream model sprawl that's been accumulating for years.
None of this means Tableau is dying — it remains the better tool for certain visualization-heavy use cases. But for the typical 50–500 person enterprise running finance dashboards, RevOps reporting, and operational metrics, Power BI is now the default answer.
Translate, don't rebuild: the question that determines your timeline
Most failed migrations have the same root cause: the team treated the migration as an opportunity to "redesign" everything. The old Tableau dashboards became "inspiration" for new Power BI builds. New visual choices, new metric definitions, new layouts. The migration team was excited. The business was not.
The problem isn't that Power BI dashboards can't look better than Tableau ones. It's that the business has already memorized what their dashboards mean. They know that the second number on the third row of the ARR walk is "expansion ARR from existing logos, contractually committed but not yet invoiced." When that number changes during a migration, even by 0.5%, finance loses confidence in every number on the dashboard. And rightly so — they don't know which other numbers also moved.
The translation-first principle: the migrated dashboard has to produce the same numbers as the Tableau original. Same calculation logic, same filter behavior, same time grain, same intermediate results. Visual layout changes are fine; semantic changes are not. Every dashboard ships with a parity test sheet that proves it before the business sees the new version.
This is also the constraint that keeps the project on schedule. Without it, every dashboard becomes a redesign discussion, every redesign becomes a stakeholder negotiation, and a 12-week project becomes 9 months. With it, the team has a clear definition of done for every workbook: the numbers reconcile, the filters behave the same way, sign-off granted.
If the business wants a redesign — different KPIs, different cuts, different layouts — that's a separate project, scheduled after the migration completes. Mixing the two is the most common reason migrations slip.
How much does Tableau to Power BI migration actually cost in 2026?
Honest cost ranges, not vendor pitches:
| Component | Typical range (USD) | What drives it |
|---|---|---|
| License savings (year 1) | Net positive: $20,000–$60,000 | Number of Creator vs Viewer seats; whether E5 is already in place |
| Migration services | $15,000–$75,000 | Number of workbooks; data-source complexity; whether semantic model needs redesign |
| Parallel licensing during cutover | $3,000–$10,000 | 2–4 weeks of running both tools while users transition |
| Training and change management | $2,000–$10,000 | End-user training (light); analyst training in DAX (heavier) |
| Infrastructure setup | $5,000–$20,000 | Data gateways, Azure setup, RLS configuration, capacity sizing |
| Hidden cost: lost analyst time | 40–120 hours | Existing internal analysts pulled in for parity testing and sign-off |
Industry pricing for a 20–50 workbook migration runs $25,000–$110,000 over 10–14 weeks. We deliver the same scope at $15,000–$28,000 on our retainer model — $5,000/month for 100 hours or $8,000/month for 160 hours, billed against the actual scope. Smaller environments (under 15 workbooks) complete in 6–8 weeks for $8,000–$15,000 with us, versus $15,000–$35,000 at typical agency rates. License savings pay back the project cost inside 12–18 months either way; the lower entry cost just shortens the payback window further.
The cost ranges most service providers quote are honest. The variable that moves the most is workbook count and complexity, not consultant rates. A finance leader's job is mostly to know how many workbooks actually need to migrate (often less than half the catalog) and to scope accordingly.
What actually breaks: the five real pitfalls
1. LOD expressions don't translate one-to-one
Tableau's FIXED LOD becomes DAX's CALCULATE + ALLEXCEPT pattern. INCLUDE LOD becomes CALCULATE with KEEPFILTERS. EXCLUDE LOD becomes CALCULATE + REMOVEFILTERS on specific columns. None of these are hard once you've written each pattern five times — but the first time, an analyst can spend a full day trying to reproduce a single LOD calculation that worked in Tableau. Migration teams that have shipped multiple migrations carry a library of 30–50 standardized LOD-to-DAX patterns; teams doing their first migration learn each pattern from scratch.
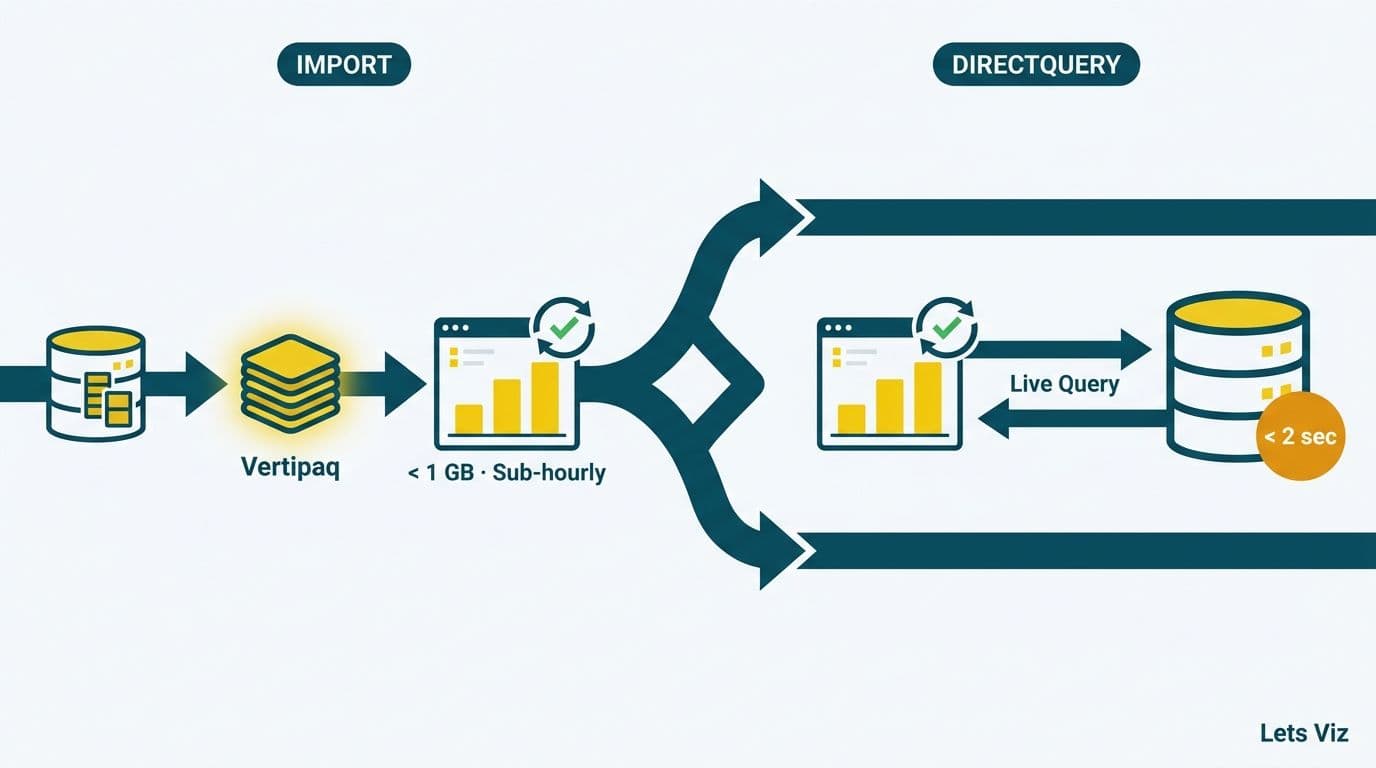
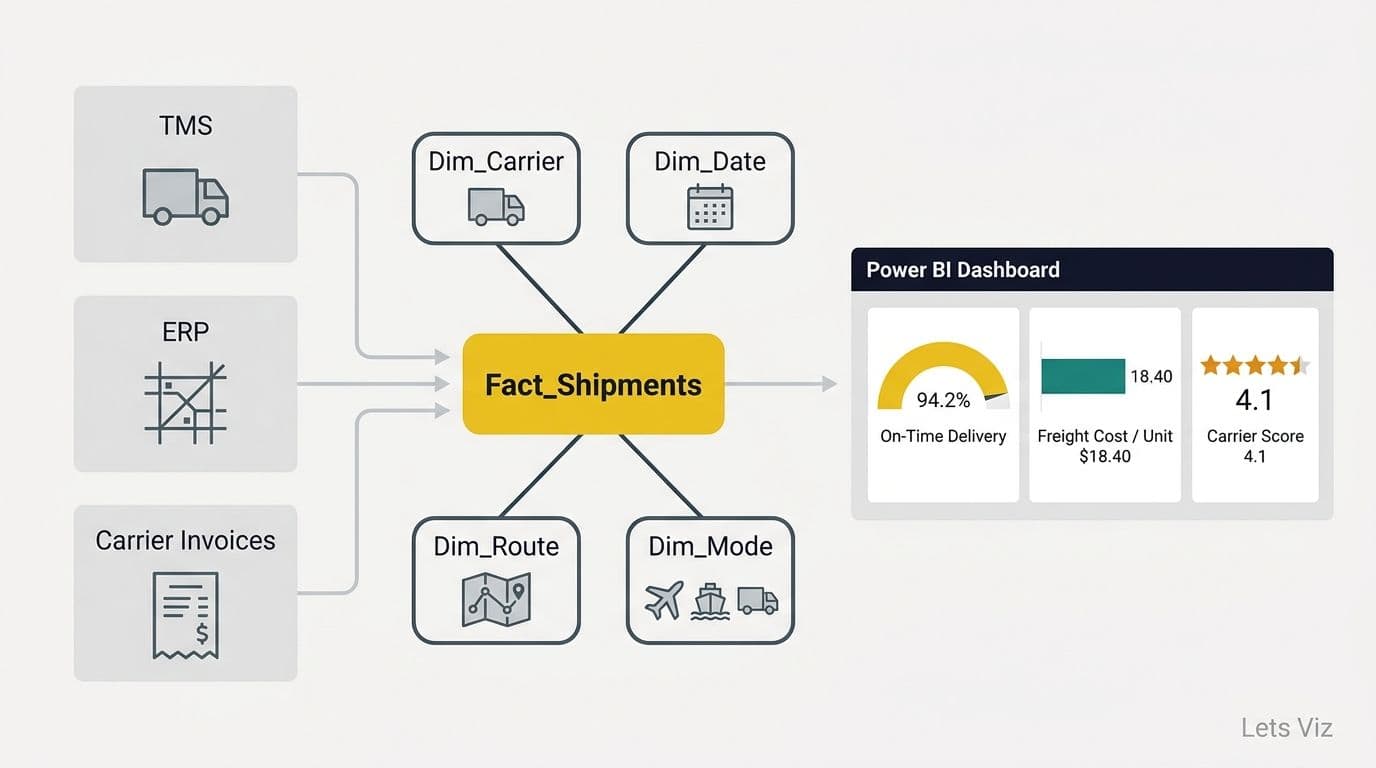
2. Power BI's data model demands a real schema
Tableau lets you connect directly to a flat data source and create calculated fields on the fly. Power BI works best with a star schema and a properly modeled semantic layer. This isn't optional for performance: a poorly modeled Power BI dataset will be slower than the equivalent Tableau extract. Migrations that skip the semantic-model step end up rebuilding it three months in, after the first user complaints about report performance.
3. Tableau Prep flows need a new home
Most Tableau Prep flows can be translated to Power Query (for dataflow-style transforms) or pushed upstream into the warehouse via dbt or stored procedures. The migration is often a good moment to evaluate which Prep flows belong in the warehouse anyway — they're cheaper to run and more reusable. Inventorying Prep flows in week 1 and deciding their target home prevents Power Query becoming a junk drawer of half-translated logic.
4. Security models are different
Tableau's project-based permissions don't map cleanly to Power BI's workspace + role-based controls. Most enterprises end up redesigning their access model during migration — often as an upgrade. The trap is leaving security as a "we'll do it last" task; migration teams that defer it discover halfway through that some workbooks need RLS rules they hadn't planned for, and the model needs revisiting.
5. The skill gap is real but bounded
A strong Tableau analyst can become productive in Power BI in about 4–6 weeks of focused practice — but they need DAX, Power Query (M), and Power BI Service deployment workflows, not just the desktop tool. Underestimating this is the most common reason internal-only migrations stall. The fix is either dedicated training time, paired work with a consultant who's done it before, or hiring a Power BI specialist for the migration period.
The 4-phase methodology that prevents rebuild disasters
Skip the generic "8-step plan." The migrations that ship on time and on budget run a 4-phase process with a clear go/no-go gate between each phase.
Phase 1 — Audit and assessment (week 1–2)
Inventory every Tableau workbook, every data source, every calculated field. Triage workbooks into migrate / consolidate / retire. Most enterprises discover 30–50% of their Tableau catalog is unused or duplicate. Map data sources to the target Power BI architecture (warehouse, gateways, refresh schedule). Output: a fixed-fee migration plan with workbook count, timeline, and final cost.
The go/no-go gate at the end of Phase 1 is critical. If the audit reveals the target architecture needs significant warehouse work first, do that work first. Migrating onto a broken data layer just creates Power BI dashboards that are wrong instead of Tableau dashboards that are wrong.
Phase 2 — Semantic model + first workbook (week 3–4)
Build the Power BI semantic model on the target warehouse. Migrate one priority workbook end-to-end through the parity test and sign-off process. The first workbook is intentionally a learning exercise — the team standardizes naming conventions, agrees on DAX patterns, and proves the parity-test workflow before scaling to bulk translation.
Phase 3 — Bulk translation (week 5–10)
Migrate remaining workbooks in priority order. Each one runs through the same parity test + sign-off loop. Typical cadence: 2–4 workbooks per sprint depending on complexity. This is the longest phase and the one that benefits most from a team that's done it before — the cumulative library of LOD patterns, the tested QA workflow, and the standardized governance approach all compound across the bulk phase.
Phase 4 — Cutover, training, decommission (week 11–12)
Run Tableau and Power BI in parallel for two sprints. Train report consumers on Power BI's interface and sharing model. Train analysts on DAX and Power Query. Phase out Tableau licenses only after every workbook owner has signed off on its Power BI replacement. Document the new environment for future maintenance.
This is the methodology our team uses on managed migrations. If you'd rather hand the entire process to a partner who's run it 12+ times, see our Tableau to Power BI Migration service — same 4-phase process, contractually guaranteed KPI parity, fixed-fee scoping at the end of Phase 1.
LOD to DAX: the translation patterns that cause the most pain
The single biggest technical hurdle in any migration is translating Tableau's Level of Detail expressions into DAX. The patterns are stable enough that any team that's done a few migrations has them memorized — but the first time through, each pattern is a research project. A few of the most common:
FIXED LOD → CALCULATE + ALLEXCEPT. A Tableau expression like { FIXED [Customer ID] : SUM([Sales]) } — total sales per customer regardless of other filters — becomes CALCULATE(SUM(Sales[Amount]), ALLEXCEPT(Sales, Sales[CustomerID])) in DAX. Same semantic, different shape.
INCLUDE LOD → CALCULATE + KEEPFILTERS. Tableau's { INCLUDE [Region] : AVG([Profit]) } respects the existing filter context but adds Region to the grouping. The DAX equivalent uses CALCULATE with KEEPFILTERS to preserve the outer filter context while introducing the new grouping.
EXCLUDE LOD → CALCULATE + REMOVEFILTERS on the excluded column. A Tableau expression like { EXCLUDE [Product] : SUM([Sales]) } — total sales ignoring the Product dimension — becomes CALCULATE(SUM(Sales[Amount]), REMOVEFILTERS(Sales[Product])).
Table calcs → measure variables + EARLIER (or RANKX, or window functions). Tableau's WINDOW_SUM, RUNNING_SUM, and INDEX functions don't have direct DAX equivalents — they need explicit measure rewrites using DAX iterator functions. This is where most analysts spend the longest.
None of this is unsolvable. But every team rediscovering these patterns from scratch is an avoidable week of cost.
Tableau vs Power BI: feature comparison (2026)
| Feature | Tableau | Power BI |
|---|---|---|
| Creator pricing | $75/user/month | $14/user/month (often bundled in Microsoft 365 E5) |
| Data model | Direct connections, calculated fields | Star schema with DAX semantic layer |
| Microsoft stack integration | Limited | Native (Entra ID, Azure SQL, Synapse, Teams, Excel) |
| AI / natural language | Tableau Pulse (limited rollout) | Copilot for Power BI (broadly available 2026) |
| Lakehouse / unified data | External warehouse only | Native via Microsoft Fabric OneLake |
| Deployment | Tableau Server / Cloud | Power BI Service (cloud) or Premium Per User |
| Governance model | Project-based permissions | Workspace + RLS + sensitivity labels |
| Best fit | Visualization-heavy analytics, data exploration | Enterprise reporting, finance and ops dashboards, Microsoft-native shops |
When hiring help actually pays back
An internal team can run a Tableau-to-Power-BI migration. Most don't, because the cumulative cost in lost analyst time, missed deadlines, and rebuilt-twice dashboards exceeds the cost of bringing in a partner who's done it before. The honest decision criteria:
- Hire help if: you have more than 20 workbooks, a finance team that depends on weekly board reporting, or a deadline driven by a Tableau license renewal. The combination of timeline pressure and KPI-parity stakes is where outside experience pays back fastest.
- Run it internally if: you have under 15 workbooks, an existing Power BI specialist on staff, and 6+ months of runway. The first-time learning curve is real but bounded, and a small environment is the best place to absorb it.
- Hybrid model: some teams run Phase 1 (audit) with a partner, get a fixed-fee plan, then decide whether to execute internally or hand off the bulk translation. This caps the risk of overcommitting to a partner before knowing the scope.
If the migration is a one-time project, see our Tableau to Power BI Migration service — fixed-fee, KPI parity contractually guaranteed, typical 10–12 week delivery. If you'll need ongoing Power BI work after the migration is done, our Managed Power BI retainer covers dashboards, pipelines, and month-end automation on a monthly basis. For one-off Power BI builds outside the migration context, our Power BI Consultant service handles fixed-fee project work.
FAQ
Is Tableau to Power BI migration worth it?
For organizations already invested in Microsoft 365 / Azure / Fabric, almost always yes — the license savings alone typically pay back the project cost in 12–18 months, and the integration with the rest of the stack reduces ongoing operational overhead. For organizations on AWS, Google Workspace, or with deep Tableau-only customizations, the calculation is less obvious and depends on workbook count and the cost of internal switching.
How long does Tableau to Power BI migration take?
For a 20–40 workbook environment, expect 10–12 weeks end-to-end including audit, parity testing, and cutover. Smaller environments (under 15 workbooks) complete in 6–8 weeks. The single biggest variable is workbook complexity, not workbook count — five LOD-heavy financial-modeling workbooks can take longer than fifty straightforward operational dashboards.
Can Tableau workbooks be imported directly into Power BI?
No direct import exists, and any tool claiming a one-click conversion produces output that needs significant manual cleanup. The reliable path is manual translation — calculated fields to DAX measures, data sources to a Power BI semantic model, dashboards rebuilt with matching logic and parity testing. Automated mapping scripts can speed up parts of this but don't replace the translation work.
Can I migrate Tableau dashboards to Power BI Fabric?
Yes, but only if you're also moving the underlying data layer. Microsoft Fabric makes most sense when you're consolidating to OneLake as your unified storage layer. For most mid-market migrations, the right first step is moving from Tableau to Power BI on your existing warehouse (Snowflake, BigQuery, Azure SQL), then evaluating whether Fabric makes sense as a separate data-platform decision later.
How do I manage security during migration?
Replicate Tableau's user access in Power BI via Row-Level Security and Entra ID (Azure AD) roles. Migration is often a good time to upgrade the access model — many Tableau environments have accumulated ad-hoc permissions over years. Building the Power BI security model from a clean spec, then migrating users into it, is usually faster than trying to mirror the legacy Tableau model exactly.
Can I run Tableau and Power BI together during transition?
Yes, and we recommend it. A 2–4 week parallel run gives users time to transition without losing access to the old environment. The cost is small (one extra Tableau renewal cycle), the risk reduction is significant, and it's the difference between a "rip the bandage off" cutover that breaks reporting for two weeks and a smooth handover where users barely notice.
What tools can help in migration?
Tabular Editor (for DAX measure management), DAX Studio (for query optimization), Power BI Helper (for data lineage), and custom Python or PowerShell scripts (for parity testing and reconciliation). Migration teams that have shipped multiple migrations carry a library of these scripts; first-time teams typically build them from scratch and lose a week or two doing it.
What's the difference between rebuilding and translating?
Rebuilding treats the Tableau dashboards as "inspiration" and creates new Power BI dashboards with new visual choices, sometimes new metric definitions, often new layouts. Translating preserves the calculation logic and the metric definitions exactly — only the visual layer changes, and even that only where Power BI's visualizations require a different shape. The translating approach is slower per dashboard but radically faster overall, because every dashboard ships once and the business never has to re-validate the numbers.
How much does it cost to hire a Tableau to Power BI consultant?
Independent specialists run $100–$200/hour for project work. Boutique BI firms quote fixed fees ranging from $15,000 (small environments) to $75,000 (50+ workbook enterprise migrations). Larger consultancies (Big 4, Microsoft GSI partners) typically run 2–3× that range. The cost-per-workbook tends to come down as the environment gets larger, because the team is amortizing the same audit + semantic model across more dashboards.
Should I hire a consultant for this migration?
If you have more than 20 workbooks, a finance or RevOps team that depends on weekly reporting, or a deadline driven by a Tableau license renewal, almost certainly yes. The cumulative cost of internal time, missed deadlines, and rebuilt-twice dashboards typically exceeds the cost of a partner who's run the playbook before. For under 15 workbooks with a Power BI specialist already on staff, internal execution is reasonable.
The Tableau-to-Power-BI move is one of the most common BI projects of 2026, and it's also one of the easiest to get wrong. The technical work is solvable; the strategic discipline of translation-not-rebuild is what separates the migrations that ship on time from the ones that quietly become the next year's cleanup project.
If you're scoping a migration and want a second opinion on the approach, book a 30-minute call — we'll look at your Tableau environment and tell you honestly whether a managed migration, an internal effort, or a hybrid model is the right fit. No pitch.