Full Stack BI Developer Roadmap: Mastering Azure Tools and Skills

Business Intelligence (BI): Unlocking Data-Driven Decision-Making
Business Intelligence (BI) involves transforming raw data into meaningful insights that empower organizations to make strategic, informed decisions. BI professionals play a pivotal role in this process by employing various tools and methodologies to analyze, visualize, and interpret complex datasets. Among these experts, BI developers stand out as the creators of sophisticated BI systems, tasked with designing, building, and maintaining solutions capable of handling complex data analysis and visualization needs.
What is a Full Stack BI Developer?
A full stack BI developer is a multifaceted professional skilled in managing both the back-end and front-end components of BI systems. They deliver comprehensive solutions by developing data pipelines, creating optimized data models, and designing reports, dashboards, and interactive applications. This role demands proficiency in a wide range of tools and technologies, effectively bridging the gap between raw data and actionable visual insights.
Why Choose Azure for Full Stack BI Development?
Microsoft Azure, a leading cloud computing platform, provides an extensive ecosystem tailored to Business Intelligence development. Its suite of tools and services supports every phase of the BI lifecycle, making it a preferred choice for developers. Key features include:
- Data Integration and Transformation: Tools like Azure Data Factory for ETL (Extract, Transform, Load) and Azure Databricks for advanced data processing.
- Data Storage: Azure SQL Database and Azure Data Lake Storage for scalable, secure data storage solutions.
- Data Analytics and Modeling: Platforms like Azure Synapse Analytics and Azure Analysis Services for in-depth data analysis and modeling.
- Machine Learning and AI: Azure Machine Learning enables predictive analytics and AI-driven insights.
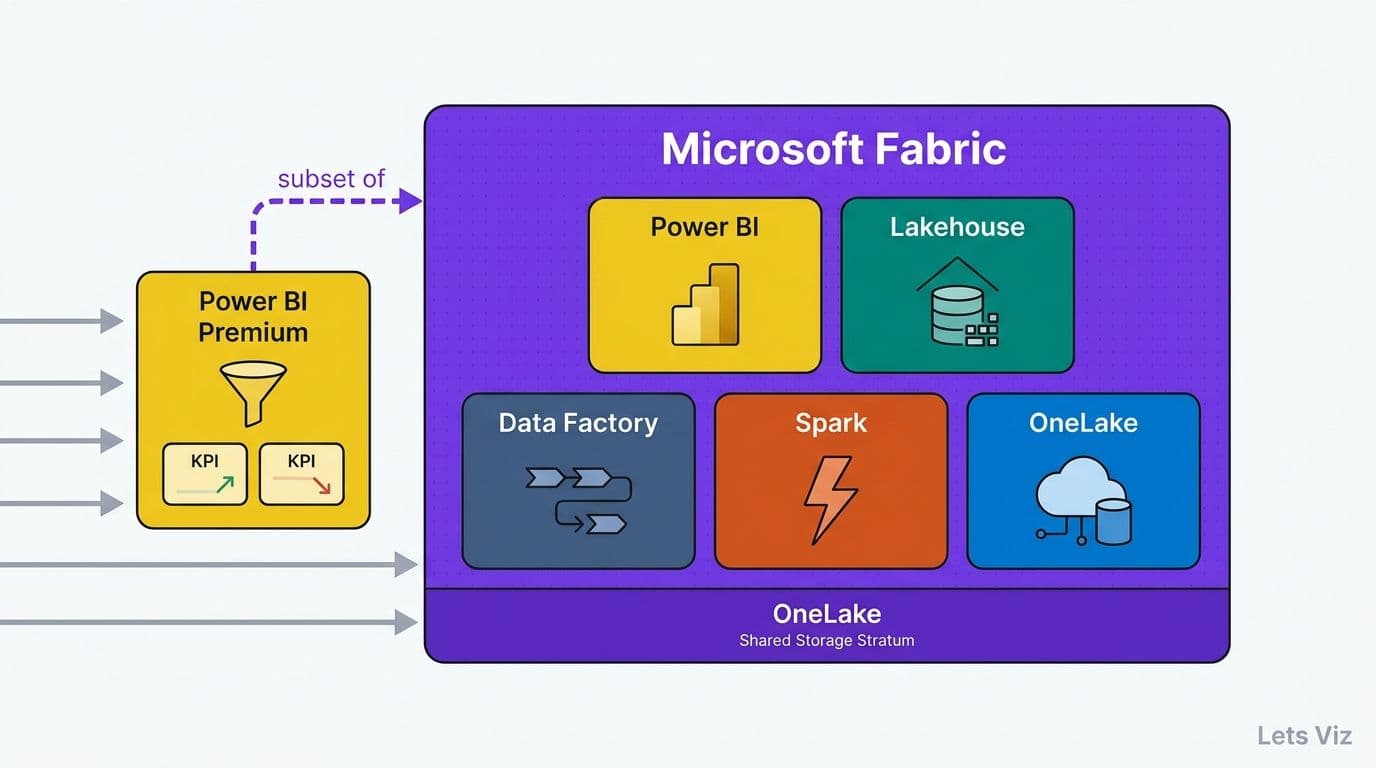
- Data Visualization: Power BI facilitates the creation of interactive dashboards and visual reports for clear communication of insights.
Azure’s scalability, robust ecosystem, and seamless integration capabilities make it a premier platform for building modern, efficient BI solutions.
A Roadmap to Becoming a Full Stack BI Developer on Azure
This blog will outline a step-by-step guide to help aspiring BI developers master Azure’s tools and become proficient in full stack BI development. Key areas include:
- Skills and Knowledge
Learn the technical and soft skills essential for success, such as data warehousing, SQL, programming, and visualization techniques. - Tools and Technologies
Explore Azure’s comprehensive set of tools and understand their roles in creating scalable BI solutions, from data ingestion to visualization. - Learning Resources and Certifications
Discover valuable resources like online tutorials, courses, and certifications, such as Azure Data Engineer Associate and Azure Solutions Architect, to validate your skills. - Best Practices and Tips
Gain insights into optimizing system performance, securing data, and adopting effective workflows when building BI solutions on Azure.
Mastering Full Stack BI Development on Azure: A Comprehensive Guide
To thrive as a full stack BI developer on Azure, you must establish a robust skill set encompassing the full lifecycle of data management, analysis, visualization, security, and governance. Here’s an in-depth look at the core areas to master:
Data Engineering
Data engineering serves as the foundation for building effective Business Intelligence systems. It includes:
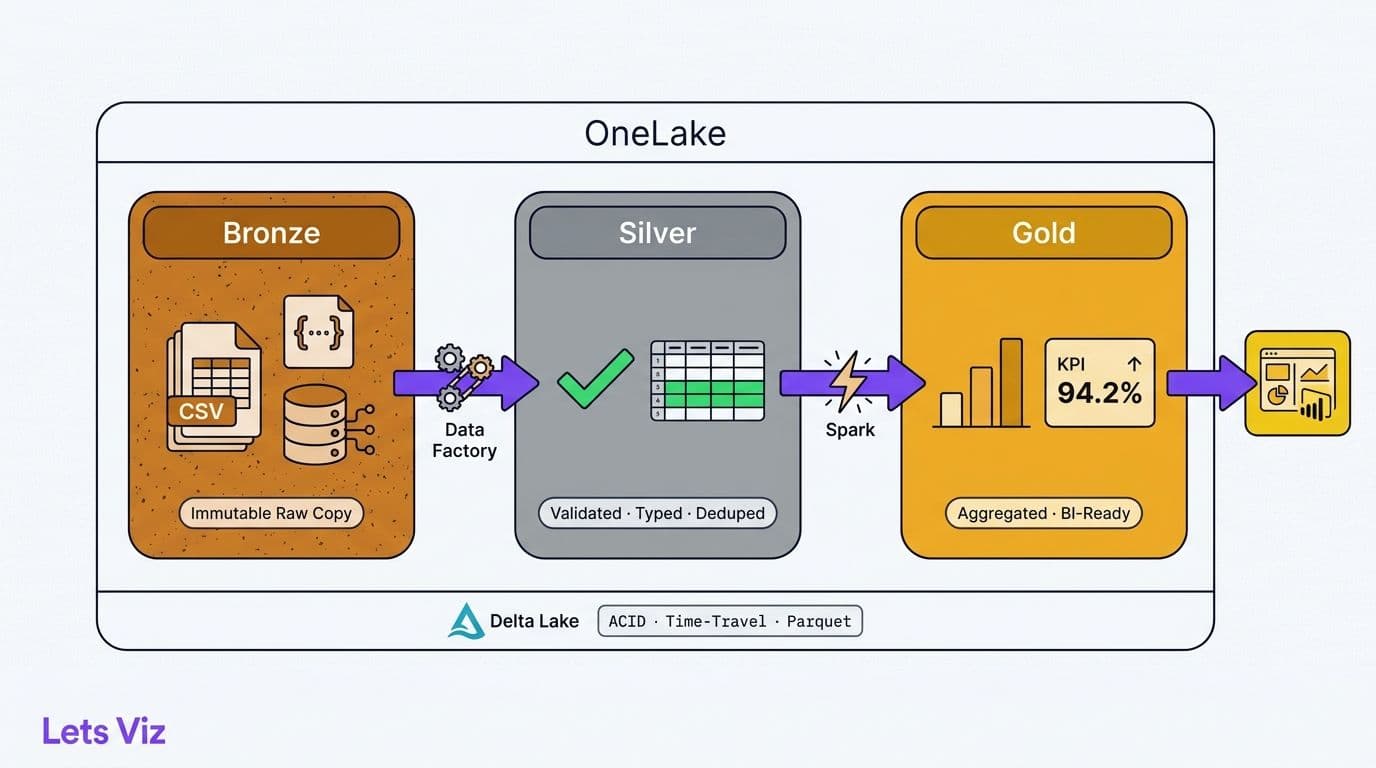
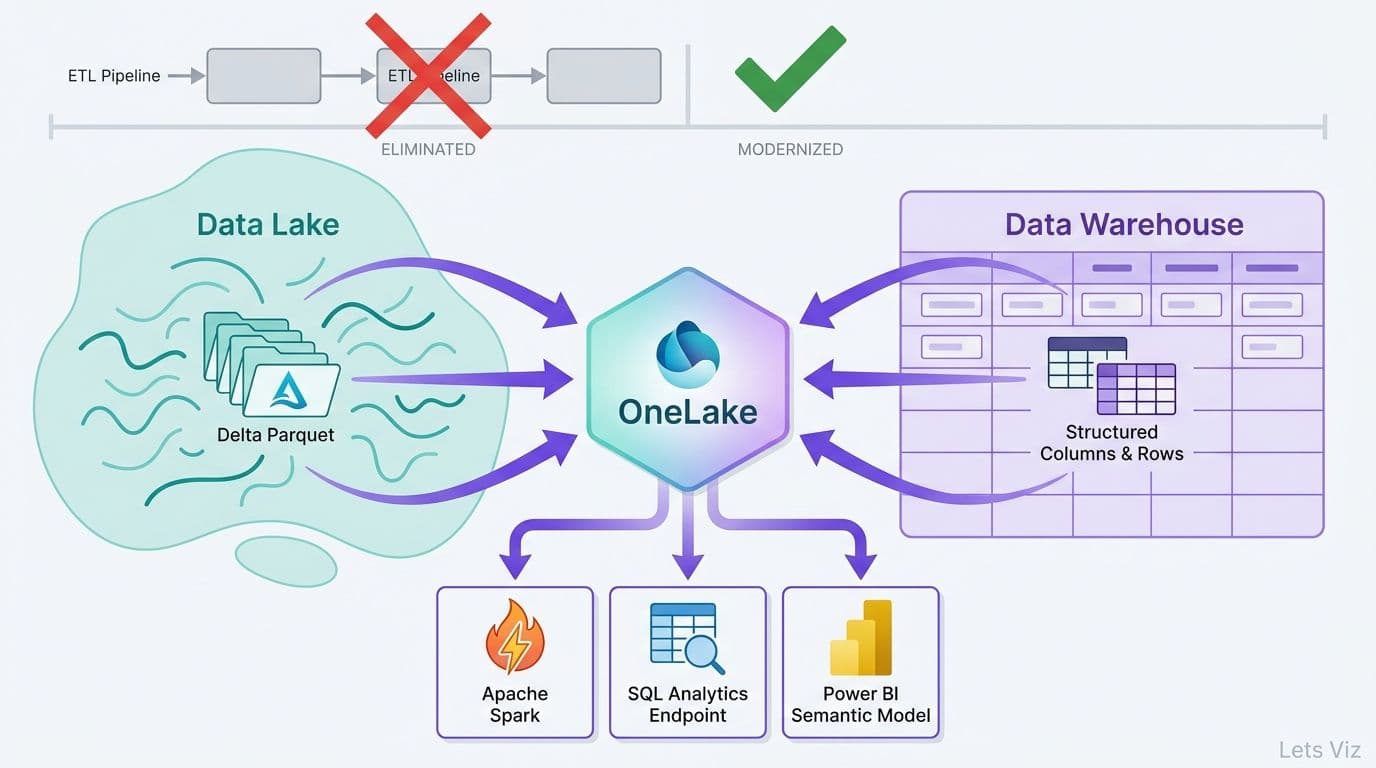
- Data Integration: Extracting, transforming, and loading (ETL) data from diverse sources into centralized storage solutions like data warehouses or data lakes. Essential tools such as Azure Data Factory, Azure Synapse Analytics, and Azure Databricks facilitate seamless creation of data pipelines.
- Data Modeling: Developing scalable and efficient data models that support complex queries and analytics. Tools like Azure Analysis Services and Power BI are instrumental in structuring data for effective analysis.
- Optimization: Ensuring that data pipelines and storage systems are reliable, scalable, and efficient enough to manage large and varied datasets.
Data Analysis
Analyzing data to extract meaningful insights is a crucial aspect of Business Intelligence. This involves:
- Statistical and Machine Learning Techniques: Applying advanced methods to uncover patterns, trends, and actionable insights. Platforms like Azure Machine Learning and Power BI provide tools for predictive modeling and in-depth analytics.
- Query Languages and SQL Expertise: Proficiency in SQL and other query languages is vital for querying and manipulating data stored in relational databases, warehouses, and other systems.
- Exploratory Data Analysis (EDA): Using statistical methods and visualization tools to understand datasets thoroughly and prepare them for advanced analytics.
Data Visualization
Turning raw data into actionable insights requires effective visualization. Key responsibilities include:
- Creating Interactive Dashboards and Reports: Using tools like Power BI and Azure Synapse Analytics to design visually appealing and interactive reports tailored to diverse audiences.
- Leveraging Advanced Features: Enhancing user interactivity with chart types, filters, slicers, and drill-down capabilities.
- Focus on Usability: Ensuring that dashboards are intuitive, easy to navigate, and aligned with stakeholder requirements.
Data Security
Securing data is a fundamental responsibility in BI development. This entails:
- Access Management: Implementing role-based access control (RBAC) with tools like Azure Active Directory and Azure Key Vault, ensuring that only authorized individuals access sensitive data.
- Encryption and Monitoring: Applying robust encryption for data at rest and in transit, and utilizing logging and auditing tools to detect unauthorized activities.
- Compliance: Adhering to organizational policies and regulatory standards to safeguard against breaches and ensure legal compliance.
Data Governance
Maintaining data integrity, consistency, and compliance ensures trustworthiness and reliability. This involves:
- Ensuring Data Quality: Utilizing tools like Azure Purview to enforce data quality standards, perform validations, and ensure consistency across systems.
- Data Lineage and Metadata Management: Tracking the movement and origin of data to improve traceability and ensure transparency. Managing metadata helps users easily interpret and utilize data assets.
- Regulatory Adherence: Ensuring compliance with industry regulations and internal policies using governance tools and Azure’s comprehensive capabilities.
To succeed as a full stack BI developer on Azure, it’s critical to integrate expertise in data engineering, analysis, visualization, security, and governance into a unified approach. By mastering these skills and leveraging Azure’s diverse ecosystem, you can create robust, scalable BI solutions that empower businesses to make informed, data-driven decisions.
Azure’s powerful tools enable you to address challenges at every stage of the BI lifecycle, positioning you as a pivotal contributor in the dynamic and rapidly evolving field of Business Intelligence.
Frequently Asked Questions :
When we talk about Full Stack BI Developers, we’re referring to professionals who can handle both the front-end and back-end of Business Intelligence systems. You’re not just limited to creating reports or analyzing data—you’re building end-to-end solutions that cover everything from integrating data to creating stunning visualizations that drive decisions.
Azure offers a robust set of tools that make BI development smooth and powerful. With tools like Azure Data Factory, Azure Synapse Analytics, Power BI, and Azure Machine Learning, we get an integrated ecosystem. It’s scalable, easy to use, and loaded with advanced analytics features, making it a go-to for BI projects.
Here’s a list of the most common Azure tools we rely on:
- Azure Data Factory for handling ETL pipelines
- Azure Synapse Analytics for integration and analytics
- Azure Analysis Services for creating data models
- Power BI for stunning visualizations
- Azure Machine Learning for predictive analytics
Think of data modeling as the bridge between raw data and actionable insights. By organizing data into structured formats, we make querying and analysis faster and more efficient. Tools like Azure Analysis Services and Power BI help us design models that simplify reporting and analytics.
Power BI works seamlessly with Azure services, giving us the tools to turn complex data into easy-to-understand dashboards and reports. It’s the final step in transforming raw data into insights that people can act on.
When working with sensitive business data, protecting it is crucial. Using tools like Azure Active Directory, encryption, and Role-Based Access Control (RBAC), we can ensure your data stays safe and only accessible to authorized users.
Traditional BI often focuses on just reporting or analytics. Full Stack BI, on the other hand, covers the entire lifecycle—from gathering and transforming data to creating interactive dashboards—giving us a complete solution.
Check out other helpful Power BI Blogs
- What are the different types of Data Analysis?
- Choosing the Right BI tool – Follow these major guidelines
- Power BI Advantages Over Tableau
- Zoho Analytics vs Power BI: Which One is right for you?
- How to Format a Power BI visualization
- The Ultimate Guide to Tableau Business Dashboards: Templates, Key KPIs, and Examples
- How to build Dynamic X and Y Axis in Power BI Using Parameters?

If you are looking forward to getting your data pipeline built and setting up the dashboard for business intelligence, book a call now from here.