Dynamic Business Insights:
Explore Our Tableau Dashboards

Discover how our interactive Tableau dashboards can transform your business data into actionable insights. View our sample KPIs and see the impact on decision-making.

Unleash Insights with Our Dynamic Tableau Dashboards

Transform your data into actionable insights with our interactive Tableau dashboards. Explore real-time KPIs, customized visualizations, and powerful analytics to drive informed decision-making and boost your business performance. Discover how our tailored dashboards can provide a clear view of your critical metrics, identify trends, and optimize your strategies for success. Dive into our sample dashboards and experience the future of data-driven management today!

Tableau Data Management services

How can our Tableau dashboards enhance your business performance?

Our Tableau dashboards are designed to provide comprehensive and actionable insights into your business operations. By visualizing key performance indicators (KPIs) in an intuitive and interactive format, our dashboards help you.

Identify Trends and Patterns

Easily spot trends, patterns, and anomalies in your data, enabling you to make informed decisions quickly.

Improve Decision-Making

Access real-time data visualizations that provide a clear picture of your business metrics, helping you make strategic decisions with confidence.

Increase Efficiency

 Our dashboards streamline data analysis processes, saving you time and resources that can be better spent on other critical business activities.

Enhance Collaboration

Share insights with your team effortlessly, fostering a data-driven culture and collaborative decision-making.

Monitor Performance

Keep track of your business performance against set targets with customized KPIs, ensuring you stay on track to achieve your goals.

Optimize Strategies

Use data-driven insights to refine and optimize your business strategies, enhancing overall performance and profitability.

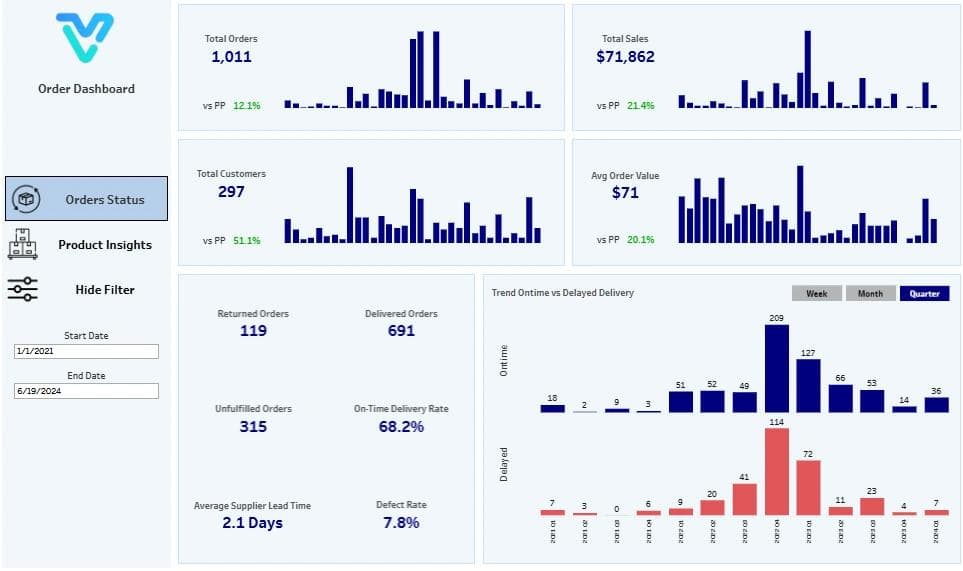
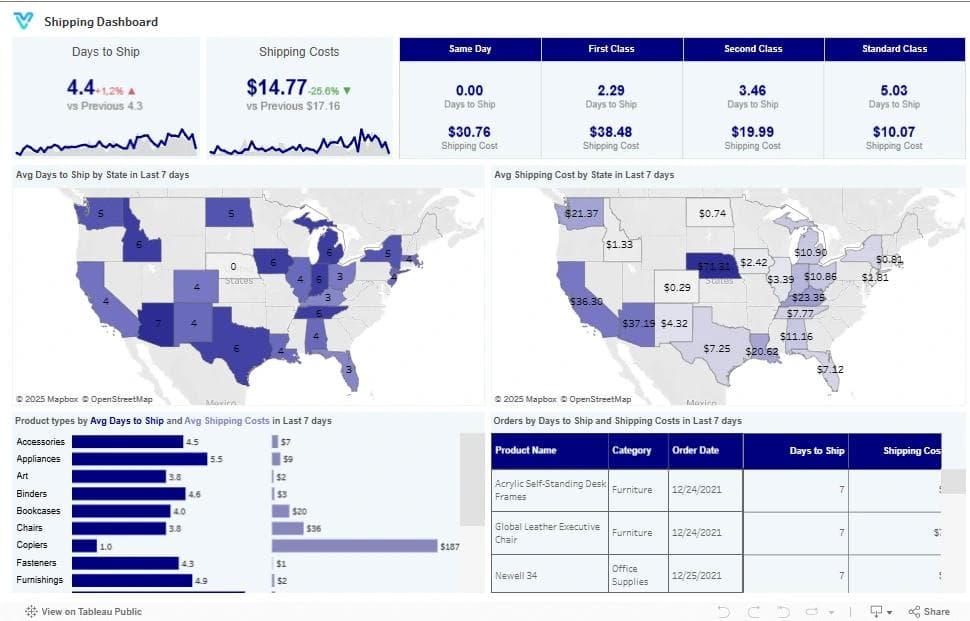
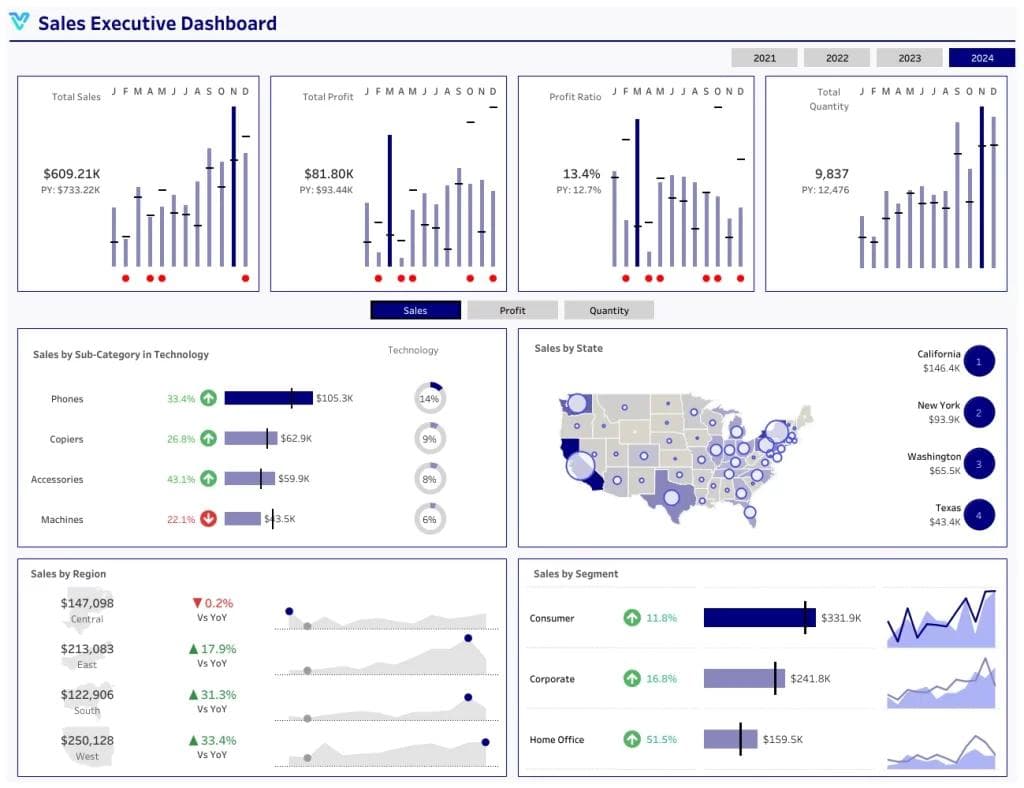
Visualize Your KPIs with Cutting-Edge Tableau Dashboards......

Track your company’s financial health and growth potential. Helpful in assessing the effectiveness of sales strategies and marketing campaigns.

Ensure liquidity and operational efficiency. Crucial for maintaining financial stability and planning for future investments.

Assess the effectiveness of your marketing and sales funnel. Important for improving lead quality and sales tactics.

Keep track of your followers’ growth on social media to increase your brand’s visibility and reach. 

Measure the effectiveness of your social media strategy. Important for increasing brand awareness and engagement.

Evaluate the effectiveness of your sales funnel and marketing efforts. Critical for optimizing sales strategies and increasing revenue.

Increase revenue through upselling and cross-selling strategies. Key for enhancing sales tactics and boosting overall profitability.

Evaluate the efficiency of your marketing and sales efforts. Crucial for budget planning and optimizing customer acquisition strategies.

Focus on long-term customer relationships and profitability. Helps in tailoring marketing efforts and customer service to high-value clients.

Assess the profitability of your core business activities. Essential for pricing strategies and cost management.

Checkout Our Insightful Tableau Dashboard Examples

Financial Analytics Dashboard Sample

Financial Analysis Dashboard

Our Financial Dashboard provides real-time insights into key financial metrics such as Revenue, Gross Profit, EBIT, Net Profit, Net Profit Margin, and Income vs. Expense. Track financial health, optimize profitability, and drive business growth effortlessly.

View Dashboard
SEO dashboard showing impressions, clicks, CTR, average position, top queries, and conversions

SEO Dashboard


Our SEO Dashboard offers real-time insights into key metrics like organic traffic, keyword rankings, backlink quality, and on-page SEO performance. Optimize your website, improve search engine rankings, and enhance online visibility with actionable data.

View Dashboard
Best Logistics Dashboard Example

Logistic Dashboard

Our Logistics Dashboard provides comprehensive insights into key KPIs such as Sales, Cost, Net Profit Ratio, Orders by Delivery Status, and Inventory to Sales ratio. Track performance, optimize operations, and ensure efficient supply chain management for enhanced productivity.

View Dashboard
Sales Dashboard Example

Sales Dashboard

Our Sales Dashboardoffers dynamic visualizations of key sales metrics such as revenue, sales trends, top-selling products, and regional performance. Gain actionable insights, identify opportunities, and drive sales growth with precision and clarity.

View Dashboard
Marketing Dashboard Example

Marketing Dashboard

Our Marketing Dashboard delivers actionable insights into campaign performance, lead generation, conversion rates, and ROI. Track key metrics, optimize strategies, and achieve marketing goals with precision and efficiency. Boost your online presence and drive business growth effortlessly.

View Dashboard
Best Customise Project Mangement Dashboard Examples

Project Management Dashboard

Our Project Management Dashboard offers clear visibility into key metrics like Total Cost, Revenue, Profit Margin, Clients, Sales Growth, and Project Performance. Optimize resource allocation, track progress, and ensure project success with ease.

View Dashboard
Shipping Dashboard

Shipping Dashboard

Our Shipping Dashboard provides clear insights into essential metrics like Shipping Costs, Delivery Revenue, Profit Margins, Carriers, Shipment Growth, and Delivery Performance. Streamline logistics, monitor progress, and ensure timely deliveries with ease.

View Dashboard
Sales Executive Dashboard

Sales Executive Dashboard

Our Sales Executive Dashboard provides clear visibility into critical metrics like Total Revenue, Sales Costs, Profit Margins, Customers, Sales Growth, and Team Performance. Streamline strategies, track progress, and drive sales success effortlessly.

View Dashboard
Sales Performance Dashboard

Sales Performance Dashboard

Our Sales Performance Dashboard delivers clear insights into essential metrics such as Total Revenue, Profit Margins, Sales Costs, Customer Growth, and Team Performance. Monitor progress, refine strategies, and boost sales outcomes with ease.

View Dashboard
Customer Service Dashboard

Customer Service Dashboard

Our Customer Service Dashboard provides clear visibility into key metrics such as Customer Satisfaction, Support Costs, Response Times, Ticket Volume, and Resolution Rates. Monitor performance, allocate resources effectively, and enhance customer support effortlessly.

View Dashboard

Order Dashboard

Our Order Dashboard provides clear insights into key metrics such as Total Orders, Revenue, Profit Margins, Customer Trends, Order Growth, and Fulfillment Performance. Track progress, manage resources, and streamline order management with ease.


View Dashboard

Frequently asked question

What is a Tableau Dashboard?

A Tableau dashboard is a visual tool that combines various charts, graphs, and data visualizations to provide a comprehensive view of key business metrics and performance indicators.

How can Tableau Dashboards benefit my business?

Tableau dashboards help you visualize data in real-time, identify trends, and make data-driven decisions. They enhance operational efficiency, improve strategic planning, and provide insights that drive business growth.

Can I customize a Tableau Dashboard for my specific needs?

Yes, Tableau dashboards are fully customizable. You can tailor the visualizations, metrics, and layout to focus on the data that matters most to your business.

What types of data can be integrated into a Tableau Dashboard?

Tableau dashboards can integrate various data sources, including spreadsheets, databases, cloud services, and third-party applications, providing a unified view of your business data.

How do Tableau Dashboards improve data visualization?

Tableau dashboards transform complex data sets into interactive, easy-to-understand visualizations. This helps you quickly identify patterns, correlations, and outliers in your data.

Are Tableau Dashboards user-friendly for non-technical users?

Absolutely! Tableau dashboards are designed with an intuitive interface, making them accessible and easy to use for individuals with varying levels of technical expertise.

Can Tableau Dashboards be accessed on mobile devices?

Yes, Tableau dashboards are mobile-friendly, allowing you to access and interact with your data on smartphones and tablets, ensuring you stay informed on the go.

How often is the data in Tableau Dashboards updated?

Data in Tableau dashboards can be updated in real-time or at scheduled intervals, ensuring you always have the most current and accurate information.


What security measures are in place for Tableau Dashboards?

Tableau dashboards use robust security measures, including data encryption, user authentication, and access controls, to ensure your data is protected and secure.

How can Tableau Dashboards help in performance tracking?

Tableau dashboards provide real-time insights into key performance indicators (KPIs), allowing you to monitor progress, identify areas for improvement, and make informed decisions to enhance overall performance.

Helping companies make data-driven decisions to achieve their Goals

Experience superior data analysis with our custom dashboards. Specializing in all tools and technologies, we turn data into visually compelling, actionable insights

Best Consulting Services

Established in 2020, Lets Viz Technologies provides a full range of high-quality data analysis and data visualization services. We are also an authorized Zoho Partner providing dashboard implementation, reporting automation, and executive KPI visibility for finance, sales, marketing, and operations teams.

Contact

WeWork Berger Delhi One, C-001/A2, Sector 16B, Noida, Uttar Pradesh 201301

0124-502-5592
info@lets-viz.com

We are Social

Trust Pilot Reviews