Total Cost
$1.2M
▲ The aggregate expenditure on all project activities, providing insights into budget utilization and cost management.
Take control of your business metrics with our Management Dashboard. Track key KPIs like Total Revenue, Profit Margin, Clients, Sales Growth, and more to maximize performance and ensure growth. Supercharge your decision-making with our all-in-one dashboard. Visualize your business data, uncover trends, and make confident decisions to enhance productivity and reach your goals faster
Track revenue, profit margin, clients, sales growth, and operational KPIs in one decision-ready management view.
Built for leadership teams with centralized KPI tracking and business-wide drill-down visibility.
Trusted by teams across 15+ countries
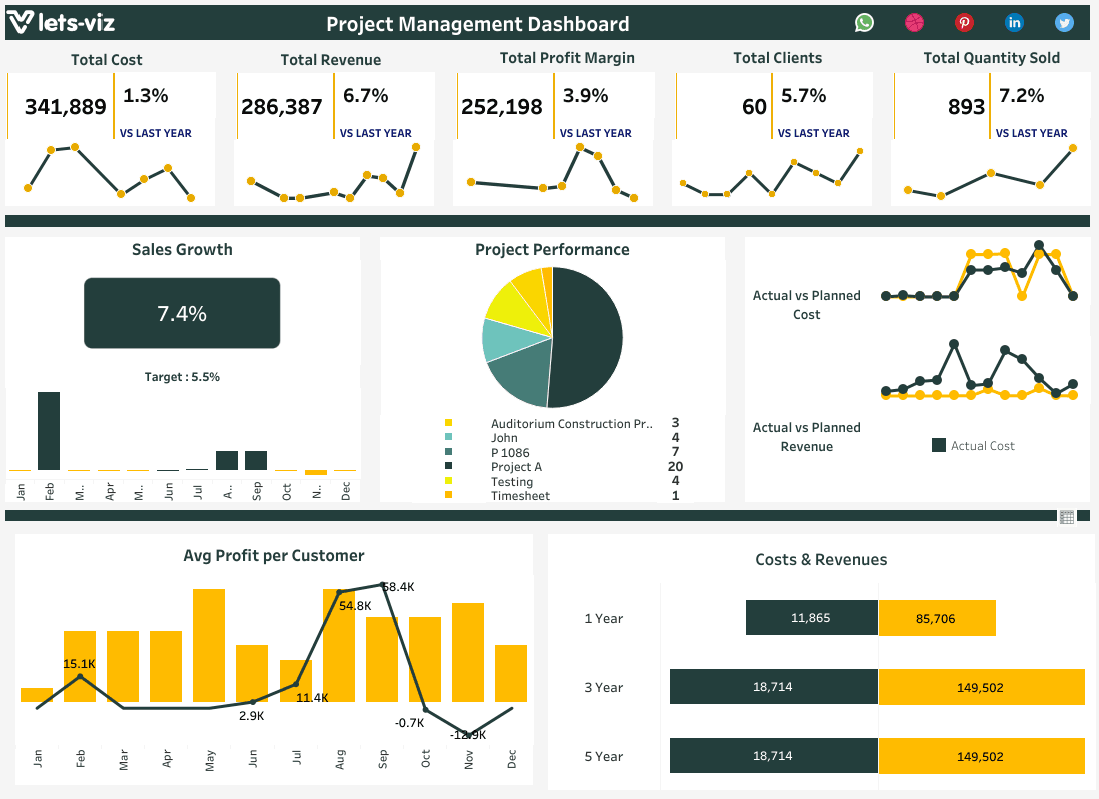
Explore the core management dashboard views built for leadership and operational decision-making.
Interactive management reporting view.
Open the live embedded management dashboard directly in a fullscreen modal.
Track cost, quantity sold, profit margin, revenue, clients, and sales growth in one place.
$1.2M
▲ The aggregate expenditure on all project activities, providing insights into budget utilization and cost management.
48.6K
▲ Total units sold across all projects, measuring market demand and sales volume.
18%
▲ Percentage of total profit relative to revenue, indicating overall project profitability and financial efficiency.
$2.4M
▲ Total income generated from all projects, indicating the overall financial performance.
186
▲ Number of clients served, reflecting the project's reach and client acquisition success.
14.2%
▲ Percentage increase in sales over a specific period, reflecting business expansion and market penetration.
These are the practical management challenges this dashboard helps teams resolve.
Dashboards provide up-to-the-minute data, allowing managers to make quick, informed decisions without waiting for delayed reports.
With immediate access to key performance indicators, dashboards speed up the decision-making process and drive timely actions.
Dashboards simplify complex data into clear visuals, helping managers focus on the most important metrics without feeling overwhelmed.
Dashboards provide a shared platform for teams to view and discuss metrics, improving collaboration and alignment.
Dashboards help track progress against set targets, enabling teams to assess if they’re on track or need adjustments.
Dashboards present data in visual formats, making analysis faster and easier, reducing the need for time-consuming manual calculations.
Pointer Sectin
Key management dashboard capabilities with context from the source page.
A management dashboard must be built to simplify the correct framework and measure each statistic in a business.
A management dashboard can consolidate all information on a single platform and include appropriate bar graphs, pie charts, or tables to make it easier to interpret.
The Let's Viz management dashboard will provide you with information such as the entire cost to the company, total revenue earned, profit margins, total customers, quantity sold, sales growth, and much more, such as sales performance and all costs and revenues associated with everything.
The Let's Viz management dashboard is the ideal tool for running your organization smoothly and effectively.
How this dashboard helps leadership teams move from fragmented reporting to faster, better-aligned business decisions.
Leadership teams often struggle with fragmented business metrics, slow reporting cycles, and limited visibility into progress across the organization.
This dashboard centralizes revenue, profitability, client, and progress KPIs in one live management view for faster leadership decisions. Want a management dashboard like this for your operations? Browse more examples in our Tableau dashboard gallery.
Find answers to common questions about this management dashboard.
A management dashboard is a visual tool that consolidates key performance data and metrics in one place. It helps businesses track progress, make data-driven decisions, and stay on top of operations by presenting insights in an easy-to-understand format.
From Lets Viz
Experience superior data analysis with our custom dashboards. Specializing in all tools and technologies, we turn data into visually compelling, actionable insights
NDA-safe · No obligation · Clear next steps