Dax Function: MOVINGAVERAGE
 Reviewed by Neetu Singla — Founder, Lets Viz Technologies — AI & Data Consultant. Last reviewed June 5, 2026.
Category: Filter Functions
The MOVINGAVERAGE function calculates the average value of a series over a specified window of time or data points, providing a smoothed view of trends. It’s commonly used in time-series analysis to reduce volatility and highlight underlying trends.
Purpose
Trend Analysis: Smooth fluctuations in data to focus on long-term trends.
Predictive Insights: Analyze data over a moving window to make informed predictions.
Comparative Metrics: Compare averages over different time periods.
Type of Calculations
Rolling Averages: Computes averages based on a sliding window of values.
Aggregations: Works with SUM, COUNT, or other aggregate measures within the specified window.
Practical Use Cases
Sales Forecasting: Identify consistent sales patterns over weeks or months.
Stock Analysis: Smooth price data to identify trends and potential trading signals.
Customer Metrics: Analyze customer retention or churn rates over time.
MOVINGAVERAGE(<expression>, <windowsize>, <direction>)
</direction></windowsize></expression>
| Parameter | Type | Description |
|---|---|---|
Expression | Numeric | The value or measure to calculate the moving average for, such as Sales[Amount]. |
WindowSize | Integer | The number of data points (rows) to include in the moving average calculation. |
Direction | String | Specifies the direction of the window: “forward”, “backward”, or “both”. |
How Does MOVINGAVERAGE Dax Works
Window Definition: Defines a rolling window of rows or time periods based on the
WindowSize.Aggregate Calculation: Calculates the average for all values within the defined window.
Sliding Mechanism: Moves the window incrementally across data points to produce a sequence of averages.
Formula Example:
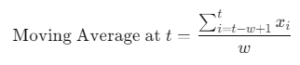
Where:
w = WindowSize
xi = Value at index ii
t = Current time index
What Does It Return?
Scalar: A numeric value representing the moving average for the specified window.
When Should We Use It?
To smooth out short-term fluctuations in volatile data.
To enhance the readability of charts or visualizations for time-series data.
To compare rolling trends across different dimensions.
Examples
Basic Usage :
Calculate a 3-point moving average for sales data:
MOVINGAVERAGE(SUM(Sales[Amount]), 3, "backward")
Column Usage
Apply a moving average to a column of daily sales data:
CALCULATE(
MOVINGAVERAGE(SUM(Sales[DailyAmount]), 5, "both"),
FILTER(ALL(Sales[Date]), Sales[Date] <= MAX(Sales[Date]))
)
Advanced Usage
Combine with time intelligence functions to calculate a monthly moving average:
CALCULATE(
MOVINGAVERAGE(SUM(Sales[Amount]), 30, "backward"),
DATESINPERIOD(Calendar[Date], MAX(Calendar[Date]), -30, DAY)
)
Tips and Tricks
Window Size Matters: Smaller windows capture more volatility; larger windows smooth trends.
Alignment: Ensure the data is sorted by date or relevant index before applying.
Combine with Time Intelligence: Use with DAX functions like
DATESINPERIODfor precise temporal analysis.
Performance Impact of MOVINGAVERAGE DAX Function:
Large Datasets: Processing large windows over many rows can impact performance; optimize by pre-aggregating data.
Indexes: Ensure proper indexing for faster calculations.
Related Functions You Might Need
AVERAGEX: Calculates the average of an expression over a table.
CALCULATE: Modifies filter context for custom calculations.
ROLLINGAVERAGE: Alternative for calculating rolling averages.
Want to Learn More?
For more information, check out the official Microsoft documentation for MOVINGAVERAGE You can also experiment with this function in your Power BI reports to explore its capabilities.
Unlock the full capabilities of Power BI and elevate your data insights with our specialized consulting services. Whether you need guidance on advanced DAX functions like those highlighted here, support in designing interactive dashboards, or expertise in optimizing data models for enhanced performance, our experienced Power BI consultants are equipped to deliver customized solutions for your business. Explore our Power BI Consulting Services page to discover how we can help your organization make smarter, data-driven decisions.
It calculates the average of values over a specified rolling window.
Yes, it is particularly useful for time-series analysis.
The function will calculate the average for the available points in the window.
AVERAGEX calculates an average over a static table, whereas MOVINGAVERAGE works over a dynamic rolling window.
Yes, but optimize the data model to handle performance challenges.
Need Power BI help in a real engagement?
Our team writes DAX like this every day for SaaS finance and ops teams. Refresh monitoring, change requests with a 2-business-day SLA, and a named analyst on retainer — or scoped hourly help if you just need a fix.
Named analyst2-day SLAFrom $5K/mo
