Clicks
126K
▲ Total number of times users click on your LinkedIn ads, indicating interest and potential for conversion.
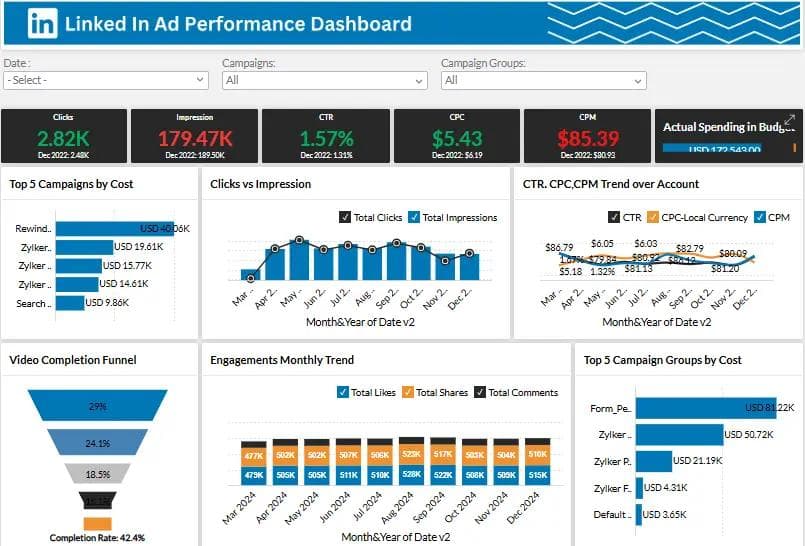
This LinkedIn Ad Performance Dashboard is built in Zoho Analytics to give your marketing and leadership teams one source of truth for impressions, clicks, CPC, CTR, CPL, cost by campaign, and ROI. We don’t just visualize ads data — we connect your LinkedIn Ads data, budget, and conversions into a single live view so you stop exporting spreadsheets every week. Want this dashboard inside your stack? Our Zoho consulting team builds and automates LinkedIn Ads reporting so your CMO and founders see results in under 30 days.
Track impressions, clicks, CPC, CTR, CPL, campaign cost, and ROI in one Zoho Analytics LinkedIn ads view.
Built in Zoho Analytics for LinkedIn ads teams with live campaign KPI tracking and spend-efficiency analysis.
Trusted by teams across 15+ countries
Explore the core Zoho Analytics LinkedIn ads dashboard views built for campaign and media-efficiency decisions.
Interactive Zoho Analytics LinkedIn ads reporting view.
Open the live embedded Zoho LinkedIn ads dashboard directly in a fullscreen modal.
Track clicks, CPC, impressions, CPM, CTR, and engagement trends in one place.
126K
▲ Total number of times users click on your LinkedIn ads, indicating interest and potential for conversion.
$1.2M
▲ Average cost incurred for each click on your LinkedIn ads, indicating ad spend efficiency.
2.8M
▲ Total number of times your LinkedIn ads are displayed, reflecting the reach and visibility of your campaigns.
$1.2M
▲ Cost of generating one thousand ad impressions, helping optimize budget allocation.
126K
▲ Percentage of ad clicks relative to impressions, measuring ad effectiveness in driving traffic.
9.6%
▲ Analysis of user interactions (likes, comments, shares) with your ads over time, providing insights into engagement patterns and campaign performance.
These are the practical LinkedIn advertising challenges this dashboard helps teams resolve.
Comparing the performance of different campaigns can be difficult without a unified system. Dashboards provide side-by-side comparisons of various campaigns, helping to identify trends and areas for improvement.
LinkedIn Ad Performance Dashboards provide real-time performance metrics, helping businesses stay on top of their campaigns. Without this, advertisers would have to rely on outdated or delayed data, leading to missed opportunities.
Managing multiple LinkedIn ad campaigns simultaneously can be overwhelming. Dashboards allow marketers to track the performance of each campaign in one place, simplifying the management process.
Conversion tracking is vital to determine whether ads are leading to desired actions (such as sign-ups, purchases, or other engagements). LinkedIn Ad Performance Dashboards make conversion tracking easier and more accurate.
With quick access to detailed metrics and performance data, LinkedIn Ad Performance Dashboards help businesses make faster, data-driven decisions. This agility helps brands stay competitive and responsive in a fast-paced digital advertising environment.
Without proper organization, large amounts of data can become overwhelming. Dashboards present information in an organized, easy-to-understand format, helping marketers focus on what matters most.
Key Details
Key LinkedIn ads dashboard capabilities with context from the source page.
See true CPL across all active LinkedIn campaigns
Spot inefficient spend before budget burns out
Compare lead quality by ad, audience, and message
Show “here’s what worked this month” without manual reporting
How this dashboard helps teams move from fragmented LinkedIn advertising reports to faster media and campaign decisions inside Zoho Analytics.
Marketing teams often struggle with delayed LinkedIn campaign visibility, fragmented spend metrics, and low confidence in CPL, CTR, and ROI tracking across reports.
This dashboard centralizes LinkedIn ads KPIs such as clicks, CPC, CTR, CPL, spend, and ROI in one Zoho Analytics view for faster paid-media decisions. Want a Zoho Analytics dashboard like this for your team? See our Zoho Analytics consulting service.
Find answers to common questions about this LinkedIn ads dashboard.
A LinkedIn Ad Performance Dashboard is a tool that provides detailed insights into the performance of your LinkedIn ad campaigns. It allows you to track key metrics like impressions, clicks, conversions, and ROI in real-time.
From Lets Viz
We’re Zoho Analytics consultants. We build LinkedIn Ads dashboards that your marketing lead and founders can actually use: spend vs budget, CPL, CTR, conversions, and campaign ROI — all in one view. No more chasing screenshots and CSVs on Monday morning.
NDA-safe · No obligation · Clear next steps