Clicks
126K
▲ Total number of times users click on your Facebook ads, indicating interest and engagement potential.
This Facebook Ads Performance Dashboard is built in Zoho Analytics to give marketing, founders, and revenue teams a single source of truth: spend, CPC, CTR, cost per conversion, campaign ROI, and which ads are actually generating pipeline. We connect your Facebook Ads data directly, so you stop exporting CSVs and chasing screenshots every week. Want this inside your own stack? Our Zoho consulting team builds and automates Facebook Ads dashboards in Zoho so you can see return on spend in under 15 days.
Track spend, CPC, CTR, cost per conversion, campaign ROI, and ad efficiency in one Zoho Analytics Facebook ads view.
Built in Zoho Analytics for Facebook ads teams with live campaign KPI tracking and spend-efficiency analysis.
Trusted by teams across 15+ countries
Explore the core Zoho Analytics Facebook ads dashboard views built for campaign and spend-efficiency decisions.
Interactive Zoho Analytics Facebook ads reporting view.
Open the live embedded Zoho Facebook ads dashboard directly in a fullscreen modal.
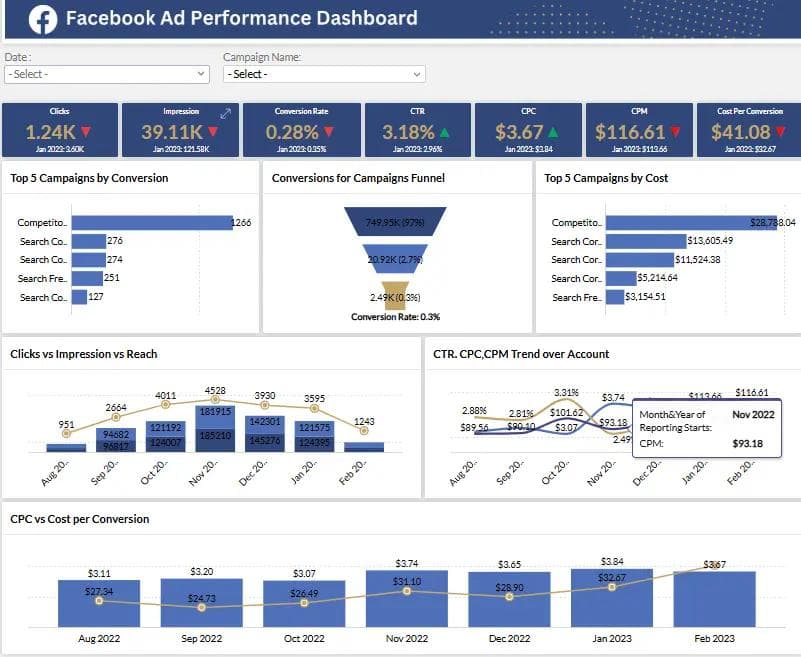
Track clicks, CRM, impressions, cost per conversion, CTR, conversion rate, CPC, and campaign cost in one place.
126K
▲ Total number of times users click on your Facebook ads, indicating interest and engagement potential.
91%
▲ Effectiveness of managing interactions with potential and current customers, influencing campaign success.
2.8M
▲ Total number of times your Facebook ads are displayed, reflecting the reach and visibility of your campaigns.
$38
▲ Average cost of achieving a conversion through your ads, indicating the efficiency of your advertising spend.
126K
▲ Percentage of clicks relative to impressions, gauging the ad's ability to attract user interactions.
3.9%
▲ Percentage of ad interactions leading to conversions, measuring the effectiveness of your ads in achieving goals.
$1.2M
▲ Average cost incurred for each click on your Facebook ads, indicating ad spend efficiency.
$128K
▲ Analysis of costs across different campaigns, helping optimize budget allocation and improve ROI.
These are the practical Facebook advertising challenges this dashboard helps teams resolve.
Facebook Ads Dashboards provide live, up-to-date insights into how your campaigns are performing. This allows advertisers to monitor key metrics like clicks, impressions, and conversions as they happen, ensuring quick adjustments to boost performance.
Instead of switching between multiple tabs or platforms, dashboards offer a unified view of all your campaign data. This helps you avoid confusion and saves time by centralizing important metrics in one place.
With detailed data at your fingertips, dashboards enable better decision-making. By tracking performance trends and understanding what’s working or not, advertisers can make informed decisions to optimize their campaigns for maximum ROI.
Understanding ad spend is crucial. Dashboards allow you to track your budget and ad spend closely, helping you prevent overspending. You can see exactly where your money is going and allocate it to the best-performing ads.
Facebook Ads Dashboards are designed with ease of use in mind. Even if you’re not a tech expert, you can navigate the platform and understand the metrics with minimal effort. This helps streamline the learning curve for new users.
A major challenge for advertisers is understanding how their ad spend translates into revenue. Facebook Ads Dashboards simplify ROI tracking by calculating the exact return from each campaign, helping businesses measure their ad spend’s effectiveness.
Key Details
Key Facebook ads dashboard capabilities with context from the source page.
See real cost per conversion (not just CPC vanity)
Spot high-cost campaigns before they burn more budget
Compare CPL and CTR across different audiences / creatives
Tie ad spend to pipeline, not just impressions
How this dashboard helps teams move from fragmented Facebook advertising reports to faster spend and campaign decisions inside Zoho Analytics.
Marketing teams often struggle with delayed Facebook campaign visibility, fragmented spend metrics, and low confidence in CPC, conversion cost, and ROI tracking across reports.
This dashboard centralizes Facebook ads KPIs such as clicks, CPC, CTR, cost per conversion, campaign spend, and ROI in one Zoho Analytics view for faster paid-media decisions. Want a Zoho Analytics dashboard like this for your team? See our Zoho Analytics consulting service.
Find answers to common questions about this Facebook ads dashboard.
A Facebook Ads Performance Dashboard is a tool that helps advertisers track, analyze, and optimize the performance of their Facebook ad campaigns by providing real-time data and insights in one central place.
From Lets Viz
We’re Zoho Analytics consultants. We build Facebook Ads dashboards that show spend vs budget, CPC, cost per conversion, CTR, conversion rate, and ROI — all in one view your CMO and founders can actually use. No spreadsheets. No “can you send me the latest numbers?” Slack messages.
NDA-safe · No obligation · Clear next steps