Total Email Sent
38.4%
▲ The number of emails dispatched, indicating the scale of your email campaigns.
Supercharge your email marketing with the Email Performance Dashboard! Instantly track opens, clicks, and conversions. Optimize campaigns on the fly and skyrocket engagement—all from one intuitive, powerful dashboard. Transform insights into success!
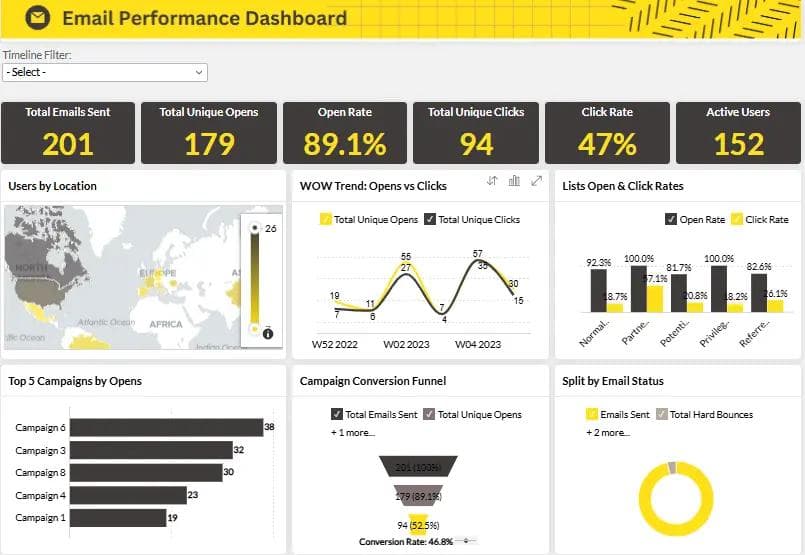
Track email sends, unique clicks, unique opens, click rate, open rate, and active users in one Zoho Analytics dashboard view.
Built in Zoho Analytics with live email campaign KPI tracking and engagement analysis.
Trusted by teams across 15+ countries
Explore the core Zoho email marketing dashboard views built for campaign engagement and optimization decisions.
Interactive Zoho Analytics email performance reporting view.
Open the live embedded Zoho email marketing dashboard directly in a fullscreen modal.
Track total email sent, total unique clicks, total unique opens, click rate, open rate, and active users in one place.
38.4%
▲ The number of emails dispatched, indicating the scale of your email campaigns.
126K
▲ The number of clicks on links within your emails, showcasing recipient interest and engagement.
38.4%
▲ Instances where recipients open your email, reflecting initial engagement and interest.
126K
▲ The percentage of unique clicks compared to total email opens, indicating the level of interaction and content relevance.
38.4%
▲ The percentage of unique email opens compared to total emails sent, measuring the effectiveness of subject lines and email timing.
41K
▲ The number of recipients who regularly engage with your emails, providing insights into audience retention and campaign effectiveness.
These are the practical email marketing challenges this dashboard helps teams resolve.
Without a proper performance dashboard, it’s difficult to gauge whether your email marketing campaigns are successful. Dashboards aggregate key metrics like open rates, click-through rates, and conversions, providing a clear, at-a-glance view of campaign performance. This helps marketers make data-driven decisions to improve future campaigns.
Email marketing involves numerous metrics—like bounce rates, unsubscribes, and list growth—that can be overwhelming to track in isolation. A dashboard consolidates these metrics in one view, allowing marketers to see the full picture and manage performance more efficiently.
Managing multiple email campaigns simultaneously can lead to confusion if you’re relying on manual tracking methods. An email performance dashboard centralizes data from all campaigns in one place, so you can easily compare results across different timeframes, audiences, or strategies. This enables better management of resources and targeted improvements.
Without a dashboard, compiling reports often requires hours of manual work, which can lead to errors and delays. Email performance dashboards automate reporting by gathering and displaying all relevant data in real-time, saving time and allowing marketers to focus on strategy and optimization
Understanding how recipients interact with your emails throughout their journey can be difficult without proper tracking. Email performance dashboards show you how users engage with emails at various stages of the funnel, from initial opens to final conversions, helping you optimize each touchpoint for maximum impact.
With detailed analytics at your fingertips, the Let’s Viz GA4 Dashboard empowers businesses to make data-driven decisions. From traffic sources to content performance, the insights offered help fine-tune strategies and maximize growth potential.
Key Details
Key email performance dashboard capabilities with context from the source page.
The number of emails dispatched, indicating the scale of your email campaigns.
The number of clicks on links within your emails, showcasing recipient interest and engagement.
Instances where recipients open your email, reflecting initial engagement and interest.
The percentage of unique clicks compared to total email opens, indicating the level of interaction and content relevance.
The percentage of unique email opens compared to total emails sent, measuring the effectiveness of subject lines and email timing.
The number of recipients who regularly engage with your emails, providing insights into audience retention and campaign effectiveness.
How this dashboard helps teams move from fragmented email reporting to faster, data-backed campaign decisions.
Marketing teams often struggle with fragmented email metrics, slow campaign reporting, and limited visibility into opens, clicks, and audience engagement.
This dashboard centralizes email sends, clicks, opens, engagement, and active-user KPIs in one Zoho Analytics view for faster campaign decisions. Want a Zoho Analytics dashboard like this for your team? See our Zoho Analytics consulting service.
Find answers to common questions about this email performance dashboard.
An Email Performance Dashboard is a powerful tool that aggregates and visualizes data from your email marketing campaigns. It tracks key performance indicators (KPIs) such as open rates, click-through rates, conversions, and more. By centralizing this data, the dashboard provides actionable insights to help optimize your campaigns and improve overall performance. It works by pulling data from your email service provider and displaying it in an easy-to-read, interactive format.
From Lets Viz
Experience superior data analysis with our custom dashboards. Specializing in all tools and technologies, we turn data into visually compelling, actionable insights
NDA-safe · No obligation · Clear next steps