Projects on Schedule
79%
▲ Share of active projects at or ahead of their baseline plan.
Schedule, budget, risks and team capacity across all projects in one view, refreshed from the tools your teams already use.
Built in Power BI on data from Jira, Azure DevOps, Microsoft Project, Smartsheet, Zoho Projects or timesheets.
Trusted by teams across 15+ countries
A portfolio view for the PMO and leadership, and a delivery view for a single programme.
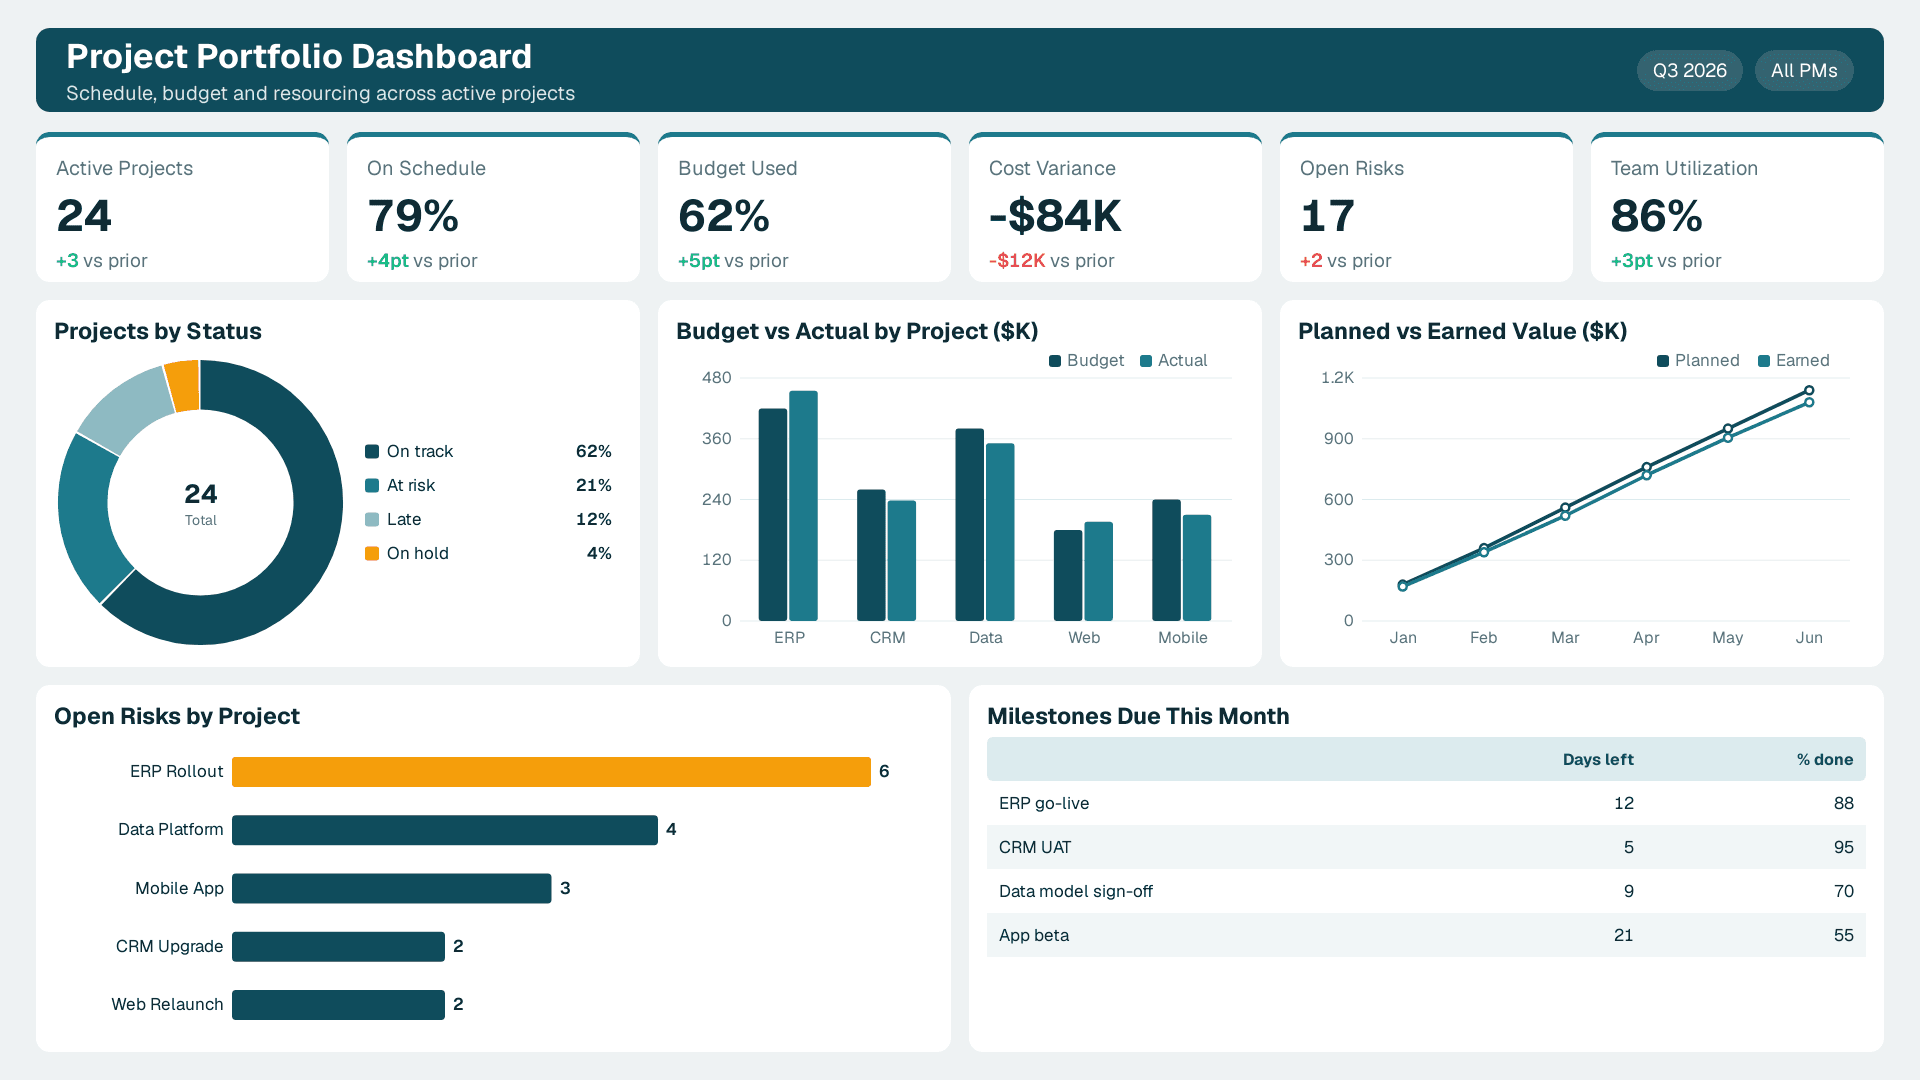
Projects by status, budget vs actual, planned vs earned value, open risks and milestones due.
Keep to the few that predict a slipped milestone or an overrun; each needs one definition across projects.
79%
▲ Share of active projects at or ahead of their baseline plan.
62%
▲ Spend to date against the approved budget, by project and in total.
-$84K
▲ Earned value minus actual cost; a negative number means work is costing more than planned.
17
▲ Live risks by project and severity, so the worst ones get airtime first.
86%
▲ Logged hours against capacity, to spot burnout and idle time early.
4
▲ Milestones due this month with days left and percent complete.
The project reporting problems PMOs and delivery leads bring to us most often.
Green-amber-red set by gut feel. The dashboard calculates status from schedule and cost data.
Cost variance and earned value show an overrun weeks before the invoice does.
Jira, Project, timesheets and finance data are joined into one model.
PMs stop building weekly decks; the dashboard refreshes on its own.
Utilization by person and team shows who is stretched before deadlines slip.
Open risks and their owners sit next to the schedule they threaten.
Each dashboard follows your methodology, stage gates, budget rules and reporting rhythm.
What Can Be Customized
Agile, waterfall or hybrid status rules
Data sources (Jira, Azure DevOps, Project, Smartsheet, timesheets)
Budget, earned value and billing logic
Views for PMO, sponsors and project managers
Common questions about project management dashboards.
A project management dashboard is one view of project health: schedule, budget, risks, resourcing and milestones, for one project or a whole portfolio, refreshed from your project tools.
From Lets Viz
We connect your project and finance tools, agree status rules with the PMO, and ship a first version in one to two weeks.
NDA-safe · No obligation · Clear next steps