Managed Ad Spend
$1.42M
▲ Total spend you run for clients this period, by channel and client.
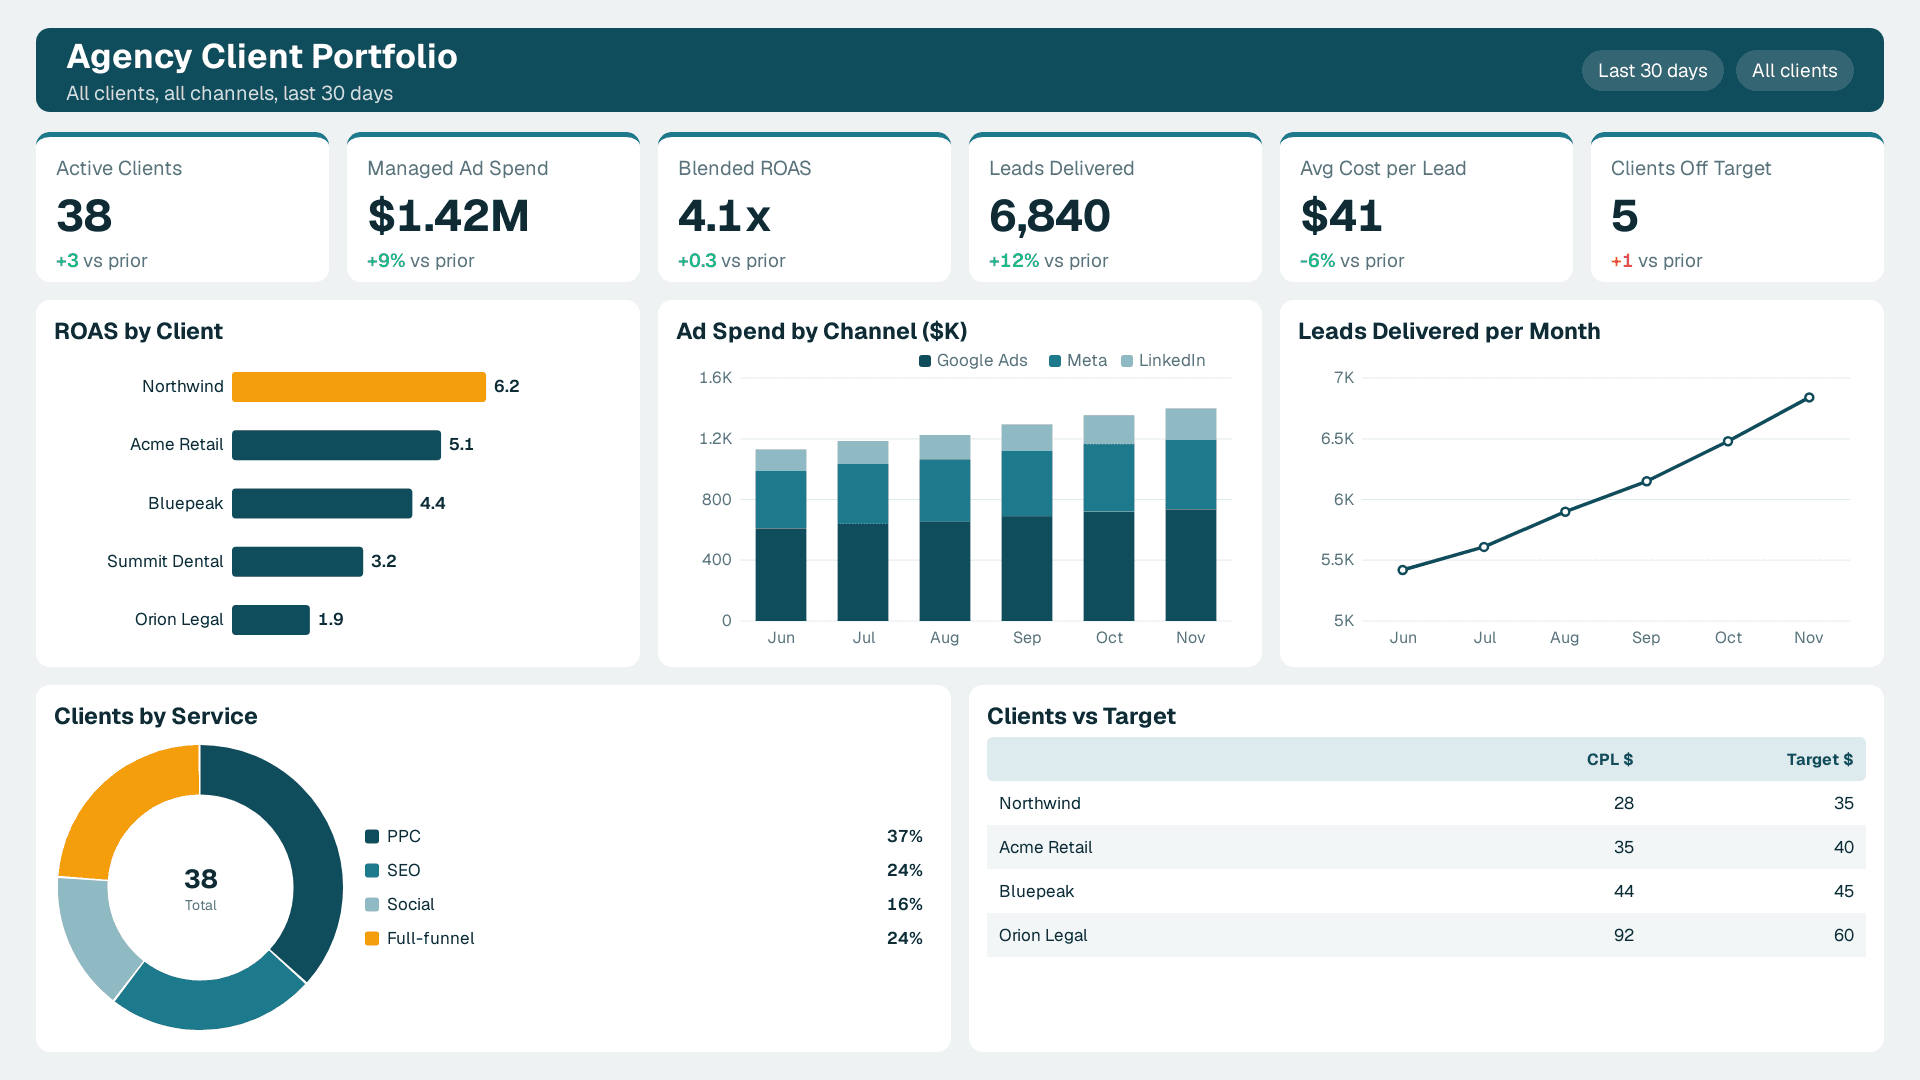
Every client's spend, ROAS, leads and targets in one view for the agency, and a live branded report for each client.
Built in Looker Studio on Google Ads, GA4, Search Console, Meta, LinkedIn and your CRM, with BigQuery when data volumes grow.
Trusted by teams across 15+ countries
A portfolio view for agency leadership and account managers, and a client-facing performance report.
Active clients, managed spend, blended ROAS, leads delivered and the clients missing their cost-per-lead target.
Track the numbers you promised clients, defined the same way across every account.
$1.42M
▲ Total spend you run for clients this period, by channel and client.
4.1x
▲ Revenue from ads divided by ad spend, across all ecommerce clients.
6,840
▲ Leads or conversions delivered to clients, against each client's target.
$41
▲ Ad spend divided by leads, by client, compared with the agreed target.
5
▲ Clients missing their cost-per-lead or ROAS target, so account managers act first.
212
▲ How often clients open their live report, a simple early sign of engagement.
The reporting problems agencies bring to us most often.
Account managers stop copying numbers into slides; reports refresh on their own.
Leadership sees every account's spend, results and targets on one page.
Clients drifting off target show up the same week, not in the next report.
One definition of a lead, ROAS and cost per lead across all accounts.
Google Ads, Meta, LinkedIn, GA4 and CRM data sit in one model.
Each client gets a live, branded link they can open any time.
Each dashboard follows your services, client targets, branding and reporting rhythm.
What Can Be Customized
Client branding and a template you reuse for each new account
Data sources (Google Ads, Meta, LinkedIn, GA4, Search Console, CRM)
Targets and alerts per client
Access so each client sees only their own data
Common questions about marketing agency dashboards.
A marketing agency dashboard is one view of performance across all your clients: spend, ROAS, leads and targets, with a client-facing report for each account, refreshed from the ad platforms and analytics tools you already use.
From Lets Viz
We connect your ad and analytics accounts, build the portfolio view and a client template, and ship a first version in one to two weeks.
NDA-safe · No obligation · Clear next steps