Total Sales
$2.4M
▲ Sales represents the total revenue generated from products or services sold. It measures the effectiveness of sales strategies and overall business performance, helping identify growth opportunities.
Track pipeline, closed-won revenue, quota attainment, and rep performance — all in a free Looker Studio sales dashboard.
Looker Sales Dashboard empowers you to make informed, data-driven decisions by centralizing key sales KPIs in one live view.
Built in Looker Studio with live sales KPI tracking and profitability drill-down analysis.
Trusted by teams across 15+ countries
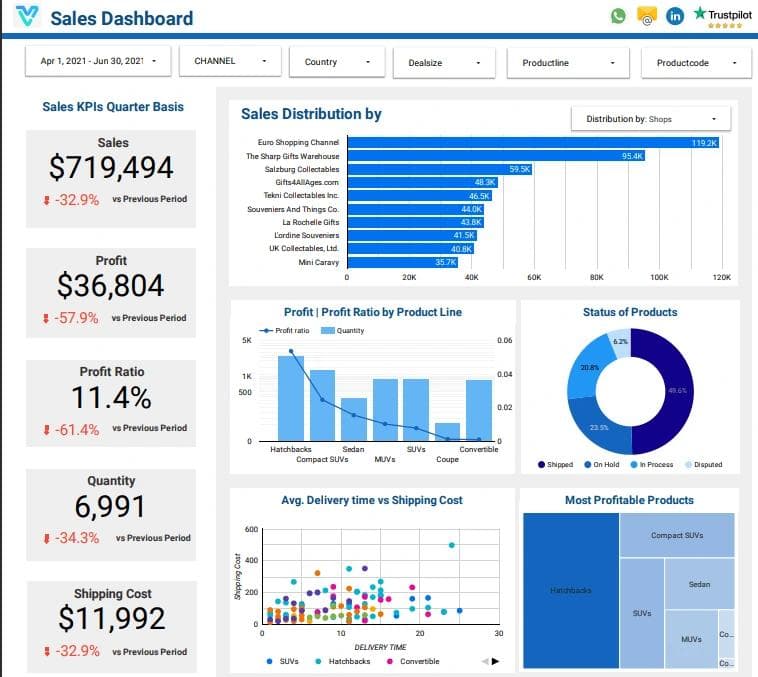
Explore the core Looker sales dashboard views built for revenue and profitability decisions.
Interactive Looker sales reporting view.
Open the live embedded finance dashboard directly in a fullscreen modal.
Track sales, profit, profit ratio, quantity sold, shipping cost, and delivery efficiency in one Looker view.
$2.4M
▲ Sales represents the total revenue generated from products or services sold. It measures the effectiveness of sales strategies and overall business performance, helping identify growth opportunities.
18%
▲ Profit is the revenue left after deducting all costs and expenses. It highlights the financial health of a business and its ability to generate returns from sales activities.
18%
▲ Profit Ratio (or profit margin) measures the percentage of profit relative to total sales. It shows how efficiently a company turns revenue into profit, indicating its overall profitability.
48.6K
▲ Quantity tracks the total number of units sold. This metric helps assess demand, inventory management, and sales performance, and is vital for understanding consumer buying patterns.
$1.2M
▲ Shipping Cost represents the total expenses incurred to deliver products to customers. It is essential for evaluating logistics efficiency and determining if shipping strategies are cost-effective.
2.1x
▲ Avg. Delivery Time measures the average duration between a customer placing an order and receiving the product. It helps assess shipping efficiency and customer satisfaction, influencing loyalty and retention.
These are the practical sales challenges this Looker Sales Dashboard helps you resolve.
Looker integrates key metrics such as Sales Volume , Profit , and Profit Ratio , giving businesses a clear view of sales effectiveness. Teams can identify if increased sales are translating to increased profits or if sales volume is being driven by low-margin products.
Looker dashboards provide a unified view of sales data, ensuring consistent insights across the entire team, eliminating discrepancies that can hinder decision-making.
Looker’s advanced data visualization tools help identify patterns in sales trends, allowing businesses to quickly adapt their strategies based on insights.
Looker enables users to customize dashboards to meet specific needs, ensuring that sales data is presented in the most meaningful and actionable way possible.
Looker provides real-time insights into sales, profit, and profit ratios, enabling businesses to track profitability over time. This helps identify whether profit margins are increasing or decreasing and what actions need to be taken.
Looker helps segment customers based on shipping costs and product quantity, making it easier to identify customer segments where shipping costs are particularly high or profits are lower, enabling businesses to adjust strategies accordingly.
Key Details
Key Looker sales dashboard capabilities with context from the source page.
Sales represents the total revenue generated from products or services sold. It measures the effectiveness of sales strategies and overall business performance, helping identify growth opportunities.
Profit is the revenue left after deducting all costs and expenses. It highlights the financial health of a business and its ability to generate returns from sales activities.
Profit Ratio (or profit margin) measures the percentage of profit relative to total sales. It shows how efficiently a company turns revenue into profit, indicating its overall profitability.
Quantity tracks the total number of units sold. This metric helps assess demand, inventory management, and sales performance, and is vital for understanding consumer buying patterns.
Shipping Cost represents the total expenses incurred to deliver products to customers. It is essential for evaluating logistics efficiency and determining if shipping strategies are cost-effective.
Avg. Delivery Time measures the average duration between a customer placing an order and receiving the product. It helps assess shipping efficiency and customer satisfaction, influencing loyalty and retention.
How this Looker dashboard helps sales teams move from fragmented reporting to faster, profit-aware decisions.
Sales teams often struggle with inconsistent data across teams, limited trend visibility, and difficulty understanding profitability and high-cost customer segments.
This Looker dashboard centralizes sales, profit, profit ratio, quantity, shipping cost, and delivery KPIs in one view for faster commercial decisions. Want a Looker Studio dashboard like this for your team? See our certified Looker Studio consulting service.
Find answers to common questions about this Looker sales dashboard.
The Looker Sales Dashboard is designed to provide businesses with real-time insights into key sales metrics, including sales, profit, profit ratio, quantity sold, and shipping costs. It helps you make data-driven decisions to optimize performance and profitability.
From Lets Viz
Experience superior data analysis with our custom dashboards. Specializing in all tools and technologies, we turn data into visually compelling, actionable insights
NDA-safe · No obligation · Clear next steps