Revenue vs Target
$4.8M
▲ Monthly and year-to-date revenue against plan, the first number most leadership meetings open with.
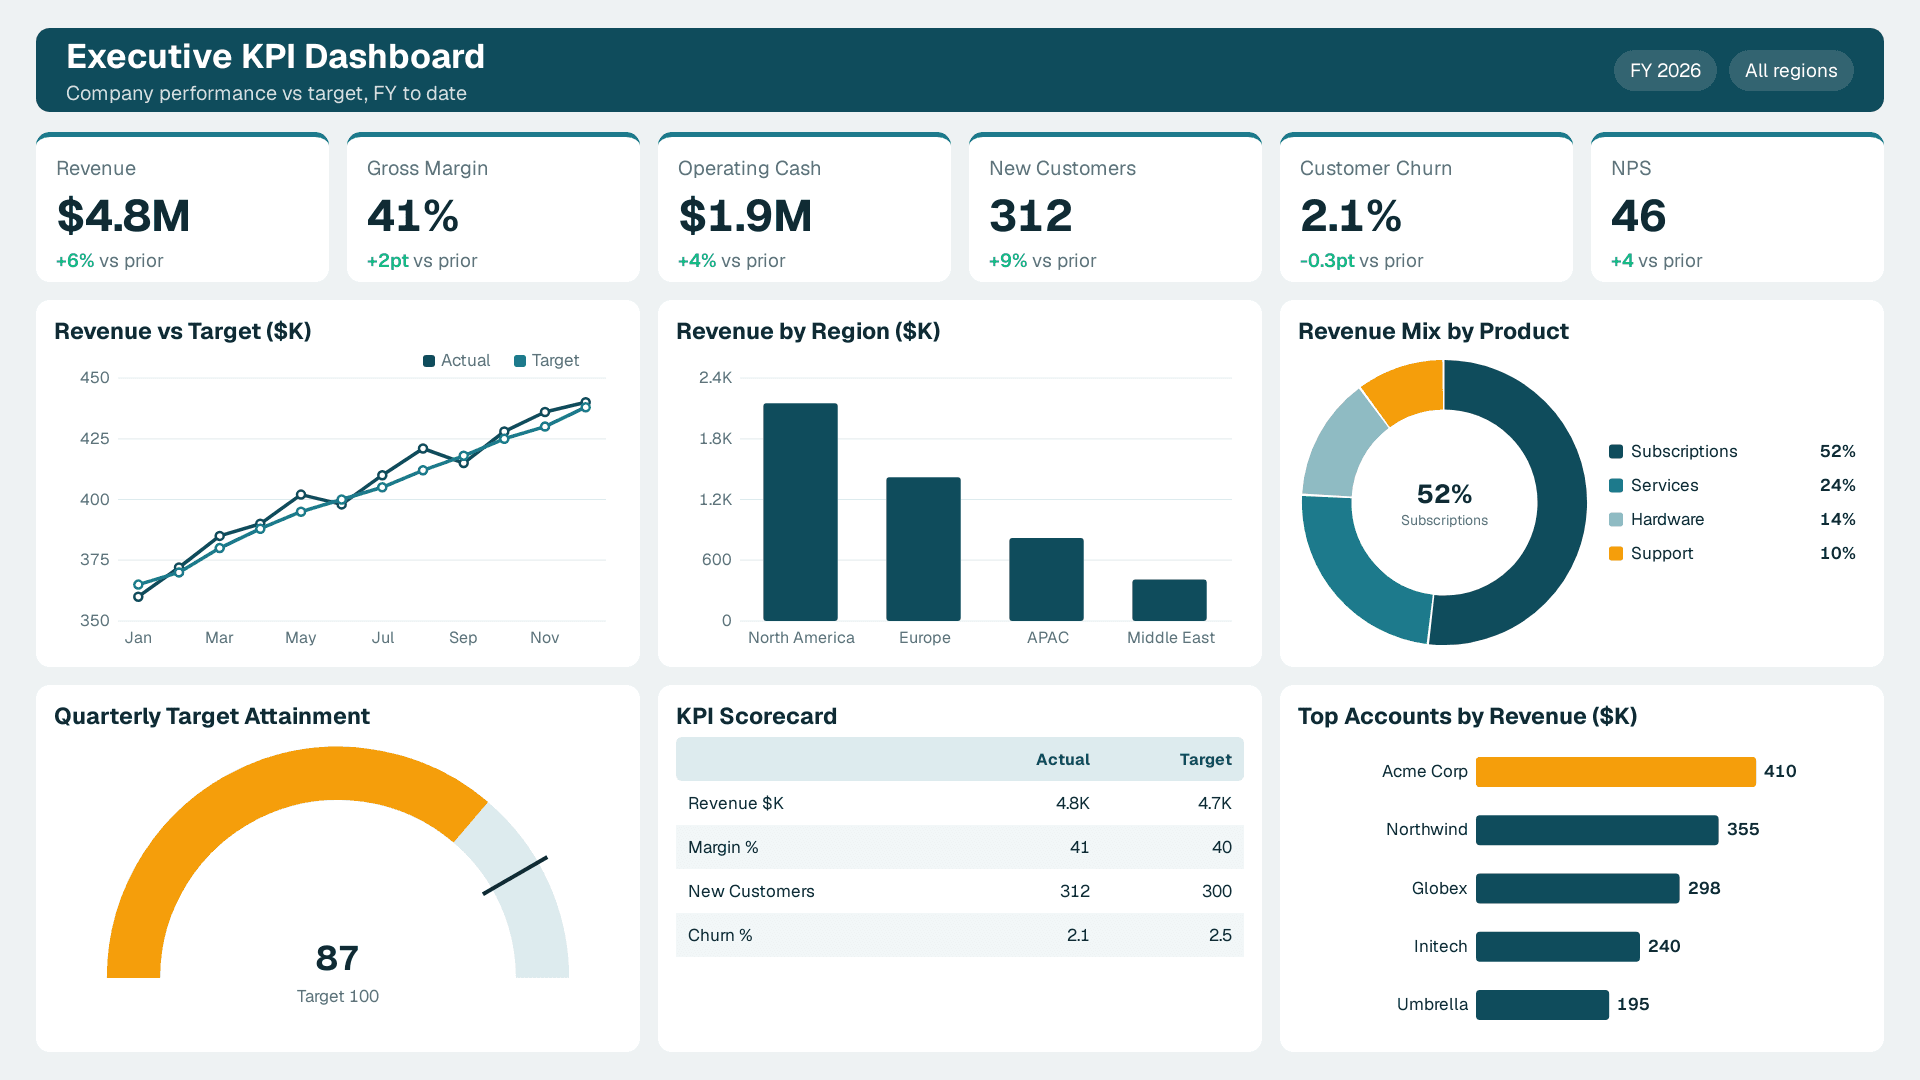
One screen, a handful of KPIs, each against its target. See three working KPI dashboard examples and how we build yours on your own data.
Built in Power BI, Looker Studio, Tableau or Zoho Analytics, connected to your ERP, CRM and finance systems.
Trusted by teams across 15+ countries
Executive, finance and sales and operations views. Each one keeps to 5-7 KPIs with targets, and the charts that explain them.
Revenue, margin, cash, new customers, churn and NPS against target, with revenue by region and a KPI scorecard.
Pick the few that drive your decisions; every KPI needs one definition, one owner and one target.
$4.8M
▲ Monthly and year-to-date revenue against plan, the first number most leadership meetings open with.
41%
▲ Shows whether growth is profitable, by product line or region.
$1.9M
▲ Operating cash and runway, so spending decisions are made against real headroom.
312
▲ Customer acquisition against target, split by channel or segment.
2.1%
▲ The share of customers or revenue lost in the period; a falling number is good.
94%
▲ Operational reliability: orders or projects delivered when promised.
The reporting problems leadership teams bring to us most often.
Monthly packs with 40 charts hide the five that matter. A KPI dashboard keeps only what drives decisions.
A number without a target is just a number. Every KPI gets a target and a green, amber or red threshold.
Sales, finance and operations each quote a different figure. One governed definition per KPI ends the debate.
Analysts spend days stitching spreadsheets. The dashboard refreshes from source systems on a schedule.
Problems show up a month after they start. Weekly or daily refresh brings them forward.
When a KPI moves, leaders need the why. Each KPI links to the detail behind it.
Each KPI dashboard is set up for your definitions, targets, data sources and meeting rhythm.
What Can Be Customized
KPI definitions, owners and targets
Data sources (ERP, CRM, finance, spreadsheets)
Refresh frequency and alerts
Role-based views for executives and teams
Common questions about KPI dashboards.
A KPI dashboard is one screen that shows a small set of key performance indicators against their targets, so leaders can see what needs action without opening a spreadsheet.
From Lets Viz
We connect your systems, agree KPI definitions and targets with your team, and ship a first version in one to two weeks.
NDA-safe · No obligation · Clear next steps