Open Pipeline
$3.6M
▲ Total value of open deals, split by stage, owner and close month.
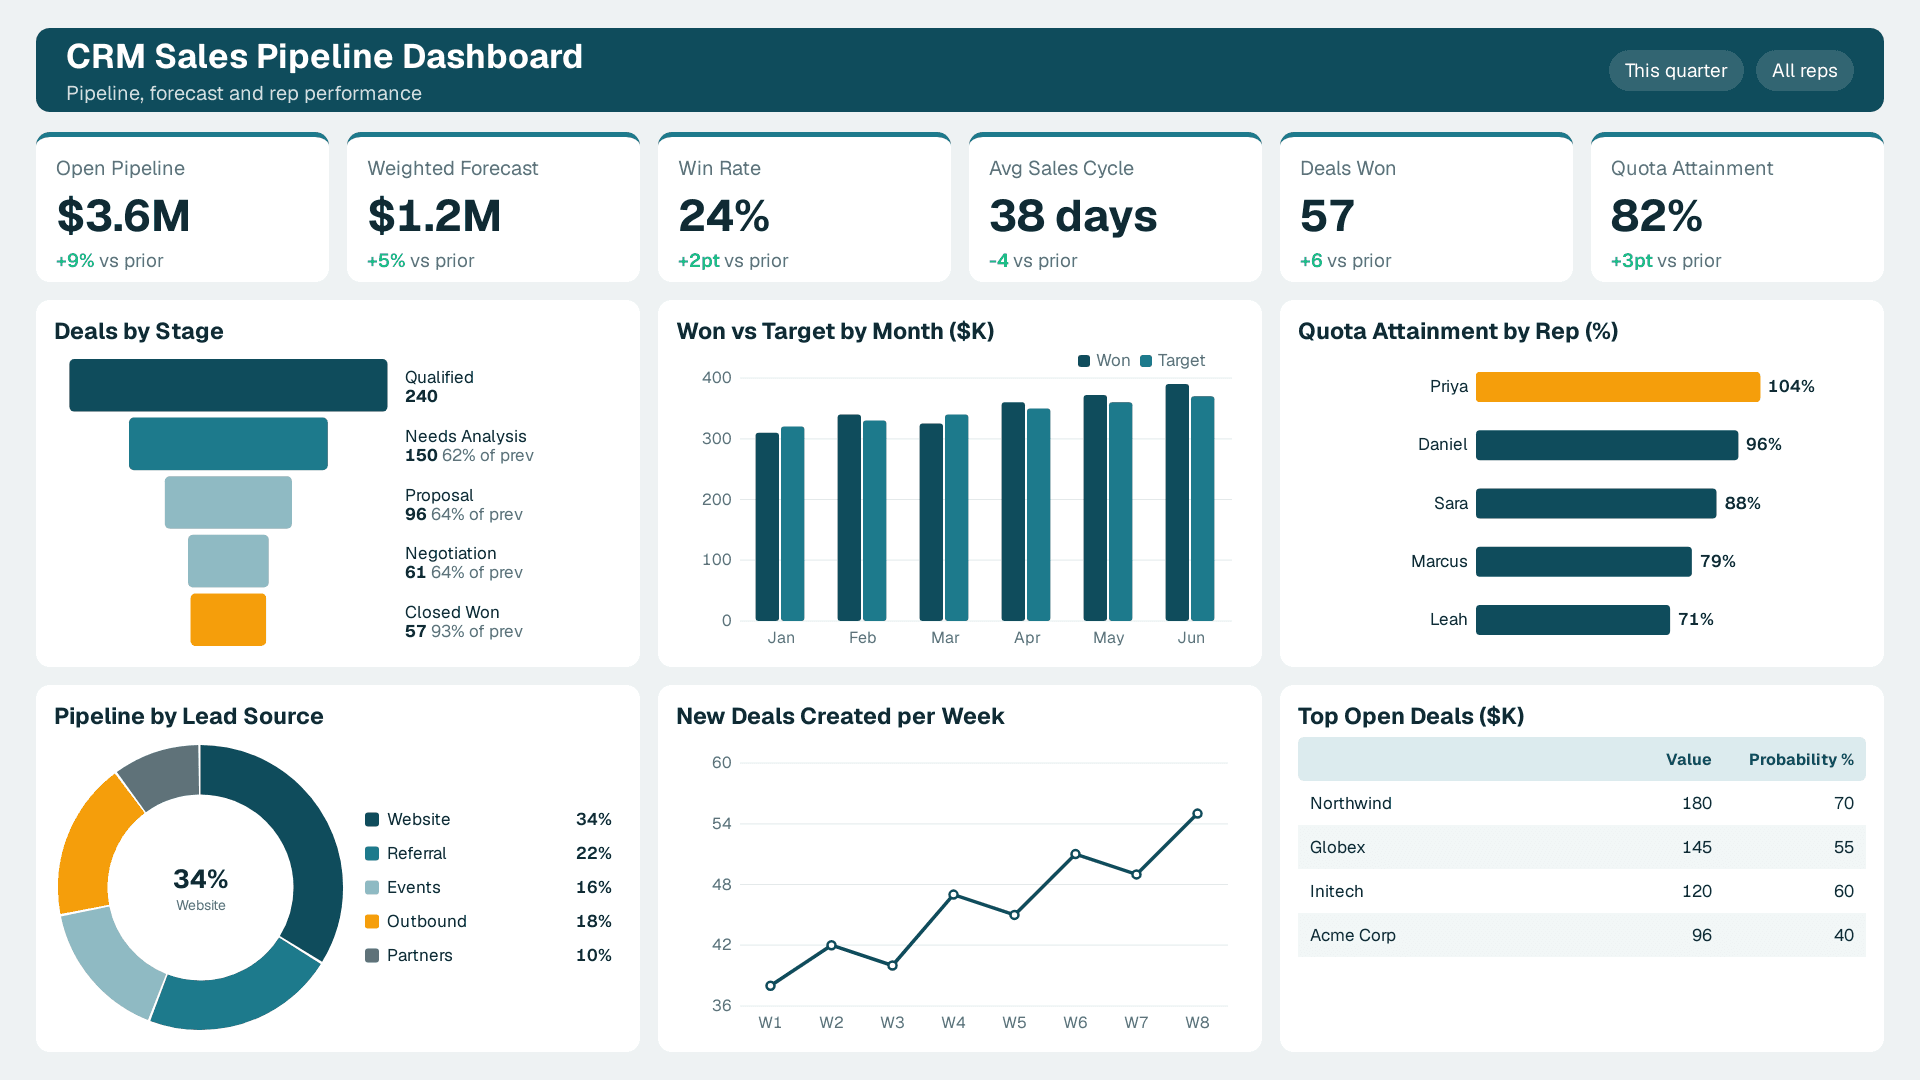
See your pipeline, forecast, rep performance and lead response in one live view, straight from your CRM.
Built in Zoho CRM and Zoho Analytics, or Power BI when CRM data meets finance and marketing data.
Trusted by teams across 15+ countries
A pipeline and forecast view for sales leaders, and an activity and customer view for sales managers.
Open pipeline, weighted forecast, win rate, sales cycle and quota attainment by rep.
Pick the ones your sales meetings run on; each needs one definition in the CRM so every rep is measured the same way.
$3.6M
▲ Total value of open deals, split by stage, owner and close month.
$1.2M
▲ Pipeline multiplied by stage probability: the number to plan the quarter on.
24%
▲ Deals won as a share of deals closed, by rep, source and deal size.
38 days
▲ Average days from deal created to closed won; shorter is better.
2.4 hrs
▲ How fast new leads get a first touch, the strongest early signal of conversion.
82%
▲ Won revenue against quota, per rep and for the team.
The CRM reporting problems sales teams bring to us most often.
Stage probabilities and close dates are applied the same way for every rep, so the forecast holds up.
Managers stop exporting CRM reports to Excel; the dashboard refreshes on its own.
Deals with no activity or a slipped close date are flagged before the quarter is lost.
Response time and untouched leads are visible per rep, every day.
Calls and meetings sit next to pipeline created, so effort links to results.
Deals join invoices, ad spend and support data when you need the full picture.
Each CRM dashboard follows your stages, territories, quotas and meeting rhythm.
What Can Be Customized
Pipeline stages and probabilities
Territories, teams and quota rules
Data sources beyond the CRM (finance, marketing, support)
Role-based views for leaders, managers and reps
Common questions about CRM dashboards.
A CRM dashboard is a live view of your CRM data: pipeline, forecast, sales activity and customer health, shown against targets so sales leaders can act without exporting reports.
From Lets Viz
We set up the dashboard on your CRM data, agree the KPI definitions with your sales leaders, and automate the refresh.
NDA-safe · No obligation · Clear next steps