Zoho Analytics vs Tableau: Which is Better Data Visualization Tool?
Starting with Zoho Analytics Or Tableau, wondering Which one is better to start with. In this Zoho Analytics vs Tableau blog, we get into deep analysis with platform capabilities to pricing to understand which one is Right for You.
is Zoho a powerful, Smarter Tableau Alternative?
Tableau is an Analytics platform that is the market leader for modern business intelligence. It makes it easier for people to explore and manage data and faster to find and share insights. Whereas With Zoho Analytics, you can choose between an easy-to-use, completely cloud-based model or an on-premise model without having to buy spare features.
All the information mentioned here was collected from the official pages of Zoho and Tableau.
Zoho Analytics vs Tableau Structure
Zoho Analytics is a Completely cloud-based or for On-Premise Completely web-based BI Tool. But Tableau’ create and share reports depending on its Desktop, server, and online versions.
In Tableau, you create your report on a Desktop and publish it to your Tableau Server or Tableau Online, and share it.
Data Import from Different Sources
| Sources |  |
 |
| Integration with third-party business apps | Yes | Yes, support more apps then Tableau |
| Integration with Zoho apps | No | Yes |
| Data Preparation | Yes | Yes |
For Easy Data Preparation clean, and prepare data Zoho Analytics comes out with Zoho data prep, and for Tableau, we use Tableau Prep for detailed preparation for normal processing Data import window has a default data preparation tool.
Creation of Report
Zoho gives users the option to generate reports automatically after importing the data in the Zoho workspace.
| Report Generate | |
|
| Automatic Generate Report | No | Yes |
| Auto Data Blending | No | Yes |
| AI-Powered automated contextual insights | Yes | Yes |
Tableau and Zoho Analytics both allow the creation of presentations that combine various visualizations in order to make compelling stories with data.
Share Visualizations
| Share |  |
|
| Visualizations | Yes, Reports created on Tableau Desktop shred via Tableau Online or Tableau Reader | Yes |
| Private Link | No | Yes |
| Email Distribution | No | Yes |
| Exporting Options | Yes | Yes |
An easy embed of visualization Offers in Zoho Analytics and also allows us to share by creating a private link where we can have a different level of security options. This link can also be customized through filter criteria.
Others Feature
| Feature | |
|
| Historical snapshotting | No | Yes |
| Embedded BI/ White-Labeling cost | Very Costly | Affordable |
For Rebranding Dashboard on your own portal, Zoho Analytics offers a great solution compared to tableau which has limited features for rebranding. The Cost for Embedding BI and white labeling is affordable for Zoho but comes very costly with tableau.
Pricing
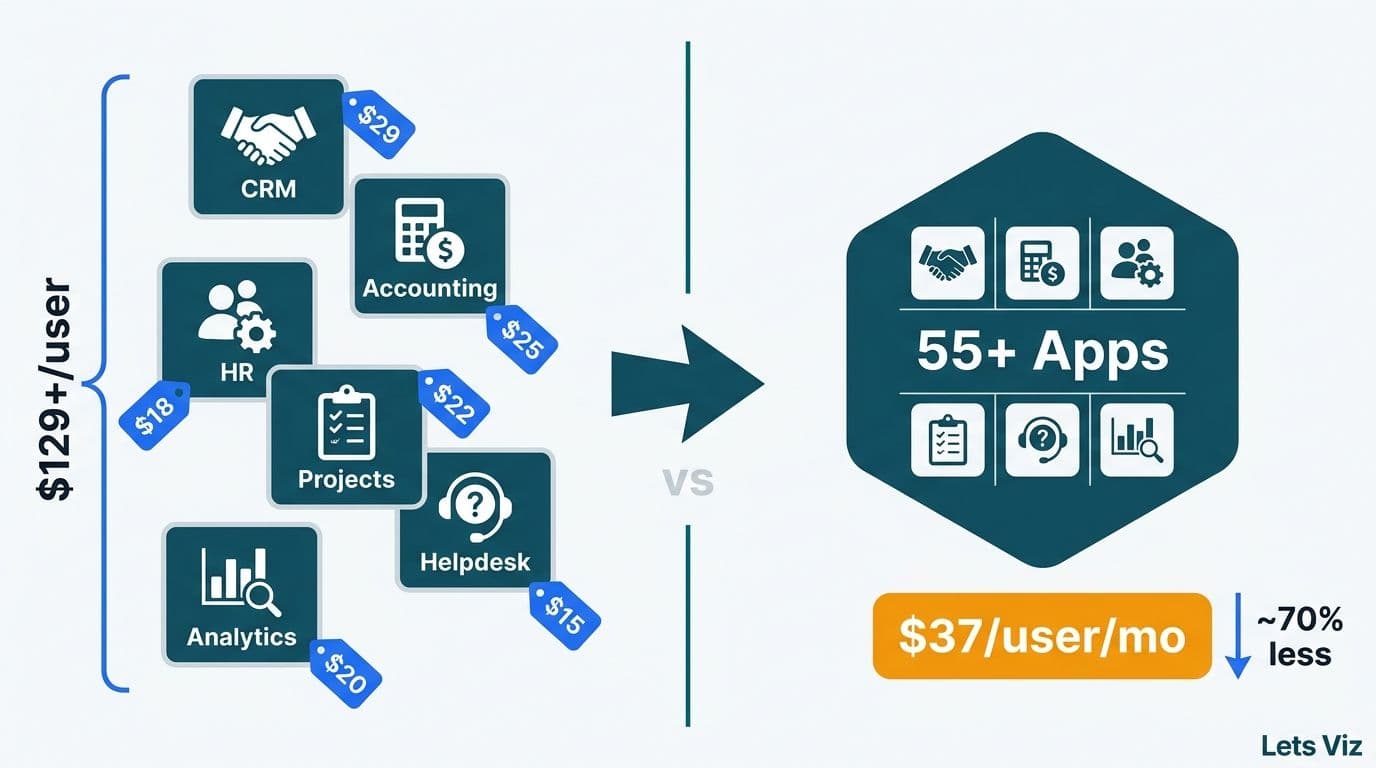
The pricing model of Cloud for Zoho analytics starts from $30 for 2 users/per month. whereas the Tableau plan has 3 types, Starting from $840 for 1 creator per Year, 5 explorers for $2520/per year, and 100 viewers for $18000 a year.
Pricing
Zoho Analytics and Tableau both offers free plan and 2 types of Pricing model of Cloud and On-Premise.
| Pricing |  |
|
| Free Plan | Yes, Tableau Public | Yes (2 Users) |
| Cloud | 1 Creator: $840 / Year 5 Explorer: $2520 / year 100 Viewer: $18000 / Year | Starts at $30 for 2 users/month |
| On-premise | 1 Creator: $840 / Year 5 Explorer: $2100 / year 100 Viewer: $14400 / Year |
Starts at $150 for 5 users/ month. |
Zoho in Comparison with other BI tools has its own strengths and weaknesses and Zoho comes out with great features in self-service BI. To explore how Zoho can be better than other tools sign up with your free Zoho Analytics account today by following this link.
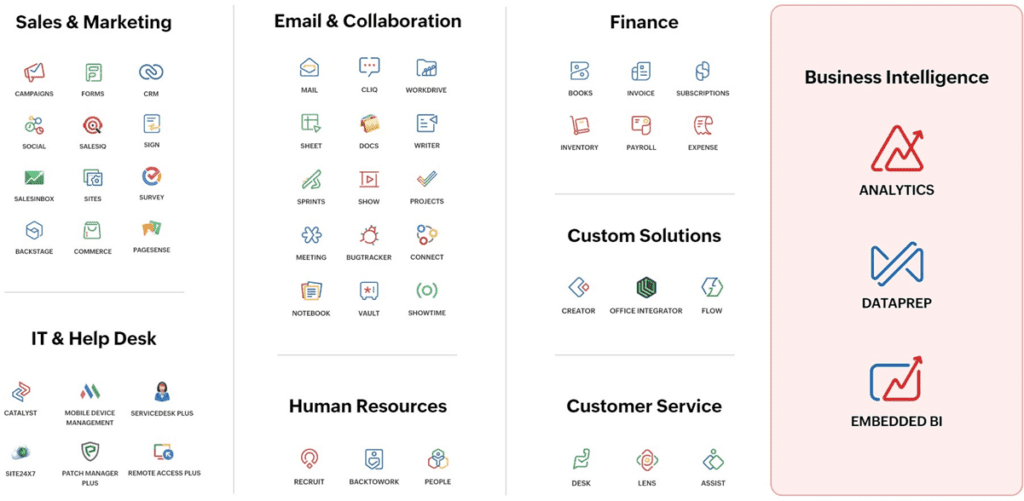
Zoho has a lot more to offer than only Analytics. Signup with Zoho One to have a free access of all service today.
As you can see, business intelligence has a lot to offer businesses of all sizes across all industries. If you’re not already using BI in your decision-making process, now is the time to start!
Check out other helpful Tableau charts below
- What are the different types of Data Analysis?
- Choosing the Right BI tool – Follow these major guidelines
- How to create a rounded bar chart in Tableau
- Edit Table calculation in Tableau
- Switch Between YoY and MoM using Parameter Selection
- Add Map Layers in Tableau
- Create and synchronize dual axis in Tableau
Follow us on Twitter, Facebook, Linkedin, and Tableau Public to stay updated with our latest blog and what’s new in Tableau.

If you are looking forward to getting your data pipeline built and setting up the dashboard for business intelligence, book a call now from here.