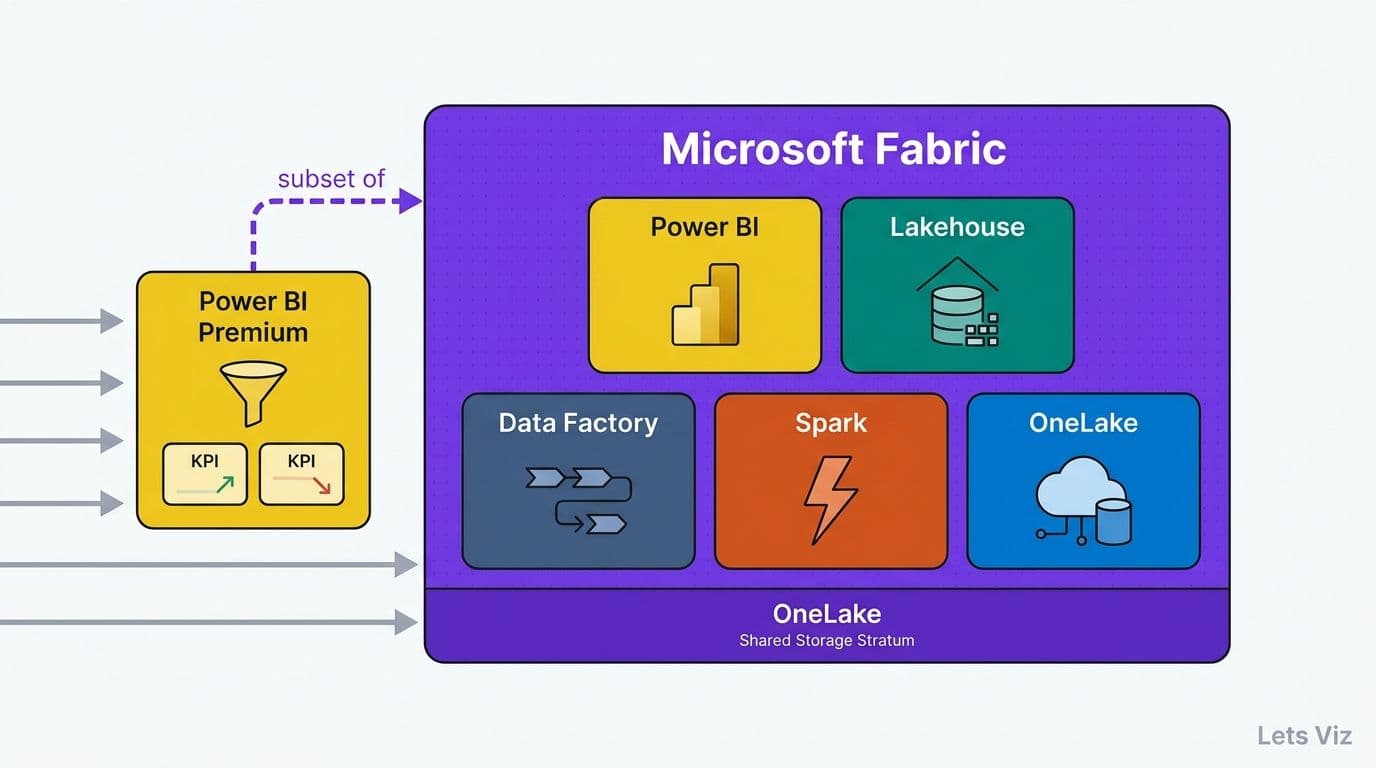
SQL IN Operator

The IN Operator in SQL is used to return the result that matches the specified values in the WHERE clause. Like the OR Operator, the IN operator works the same. For multiple OR operators, the IN operator can be used as its shorthand.
- Syntax of IN Operator –
SELECT column1,column2,column3,...,columnN FROM table_name WHERE column_name IN (value1,value2,...);
Demo Table –
Product Table
| Category | Region | City | Country | Customer_ID | Customer_name |
| Office Supplies | Central | Chicago | United States | SM-20950 | Suzanne McNair |
| Technology | East | New York City | United States | AH-10465 | Amy Hunt |
| Office Supplies | East | New York City | United States | AH-10465 | Amy Hunt |
| Office Supplies | East | Dover | United States | EP-13915 | Emily Phan |
| Office Supplies | East | Dover | United States | EP-13915 | Emily Phan |
| Technology | West | Aurora | United States | TP-21565 | Tracy Poddar |
| Office Supplies | West | Aurora | United States | TP-21565 | Tracy Poddar |
| Office Supplies | East | Long Beach | United States | AR-10825 | Anthony Rawles |
| Office Supplies | West | Pasadena | United States | HA-14920 | Helen Andreada |
| Furniture | West | Pasadena | United States | HA-14920 | Helen Andreada |
Manager Table
| Region | Regional Manager |
| West | Sadie Pawthorne |
| East | Chuck Magee |
| Central | Roxanne Rodriguez |
| South | Fred Suzuki |
Example – Consider the Product table of the Customer database where we want to get those Customer Name, Category, City, and Country whose category belongs to “Technology” and “Furniture”.
SELECT [Customer Name],Category,City,[Country/Region] FROM [dbo].[Products] WHERE Category IN ('Technology','Furniture');
The output after implementing the above statement shows the columns where the category is “Technology” or “Furniture” –
| Category | Region | City | Country | Customer_ID | Customer_name |
| Technology | East | New York City | United States | AH-10465 | Amy Hunt |
| Technology | West | Aurora | United States | TP-21565 | Tracy Poddar |
| Furniture | West | Pasadena | United States | HA-14920 | Helen Andreada |
Subqueries with IN Operator
The values within IN Operator can be replaced by the SELECT statement. Then the values returned by the SELECT statement can be used as the literal/values for IN operator. It helps the user to be quicker with values and literal.
- Syntax of IN Operator with Subqueries –
SELECT column1,column2,column3,...,columnN FROM table_name WHERE column_name IN(SELECT Statement...);
Example – Consider the Product table of the Customer database where we want to get those Customer Names, Categories, cities, and regions whose category belongs to “EAST” and “WEST”. Use the People table for returning Region.
SELECT [Customer Name],Category,City,Region FROM [dbo].[Products] WHERE Region IN (SELECT Region FROM [dbo].[Manager] WHERE Region IN('East','West'));
The output after implementing the above statement shows the columns using the subquery –
| Category | Region | City | Country | Customer_ID | Customer_name |
| Technology | East | New York City | United States | AH-10465 | Amy Hunt |
| Technology | West | Aurora | United States | TP-21565 | Tracy Poddar |
| Furniture | West | Pasadena | United States | HA-14920 | Helen Andreada |
| Office Supplies | East | Dover | United States | EP-13915 | Emily Phan |
| Office Supplies | East | Dover | United States | EP-13915 | Emily Phan |
| Technology | West | Aurora | United States | TP-21565 | Tracy Poddar |
| Office Supplies | West | Aurora | United States | TP-21565 | Tracy Poddar |
| Office Supplies | East | Long Beach | United States | AR-10825 | Anthony Rawles |
| Office Supplies | West | Pasadena | United States | HA-14920 | Helen Andreada |
| Furniture | West | Pasadena | United States | HA-14920 | Helen Andreada |
Other SQL topics to check out:
Follow us on Twitter, Facebook, Linkedin, and Tableau Public to stay updated with our latest blog and what’s new in Tableau.
- How to write SQL Select Statements
- Introduction to SQL for Data Scientists
- What is RDBMS (Relational Database Management System)?
- SQL WHERE Clause
- SQL SELECT Statements

If you are looking forward to getting your data pipeline built and setting up the dashboard for business intelligence, book a call now from here.
#analytics #data #business #artificialintelligence #machinelearning #startup #deeplearning #deeplearning #datascience #ai #growth #dataanalytics #india #datascientist #powerbi #dataanalysis #tableau #SQL #businessanalytics #businessanalyst #businessandmanagement #dataanalyst #businessanalysis #analyst #analysis #powerbideveloper #powerbidesktop #letsviz