How to get control of your data preparation challenges?
No matter the industry, data is an essential part of business. In order to make sound decisions, you need to have quality data that is up-to-date and accurate. Data preparation is the process of cleaning and organizing raw data so that it can be used for further analysis.
However,
This process can be quite challenging, as it requires both technical expertise and a keen attention to detail. Let’s take a look at some of the most common data preparation challenges and how to overcome them.
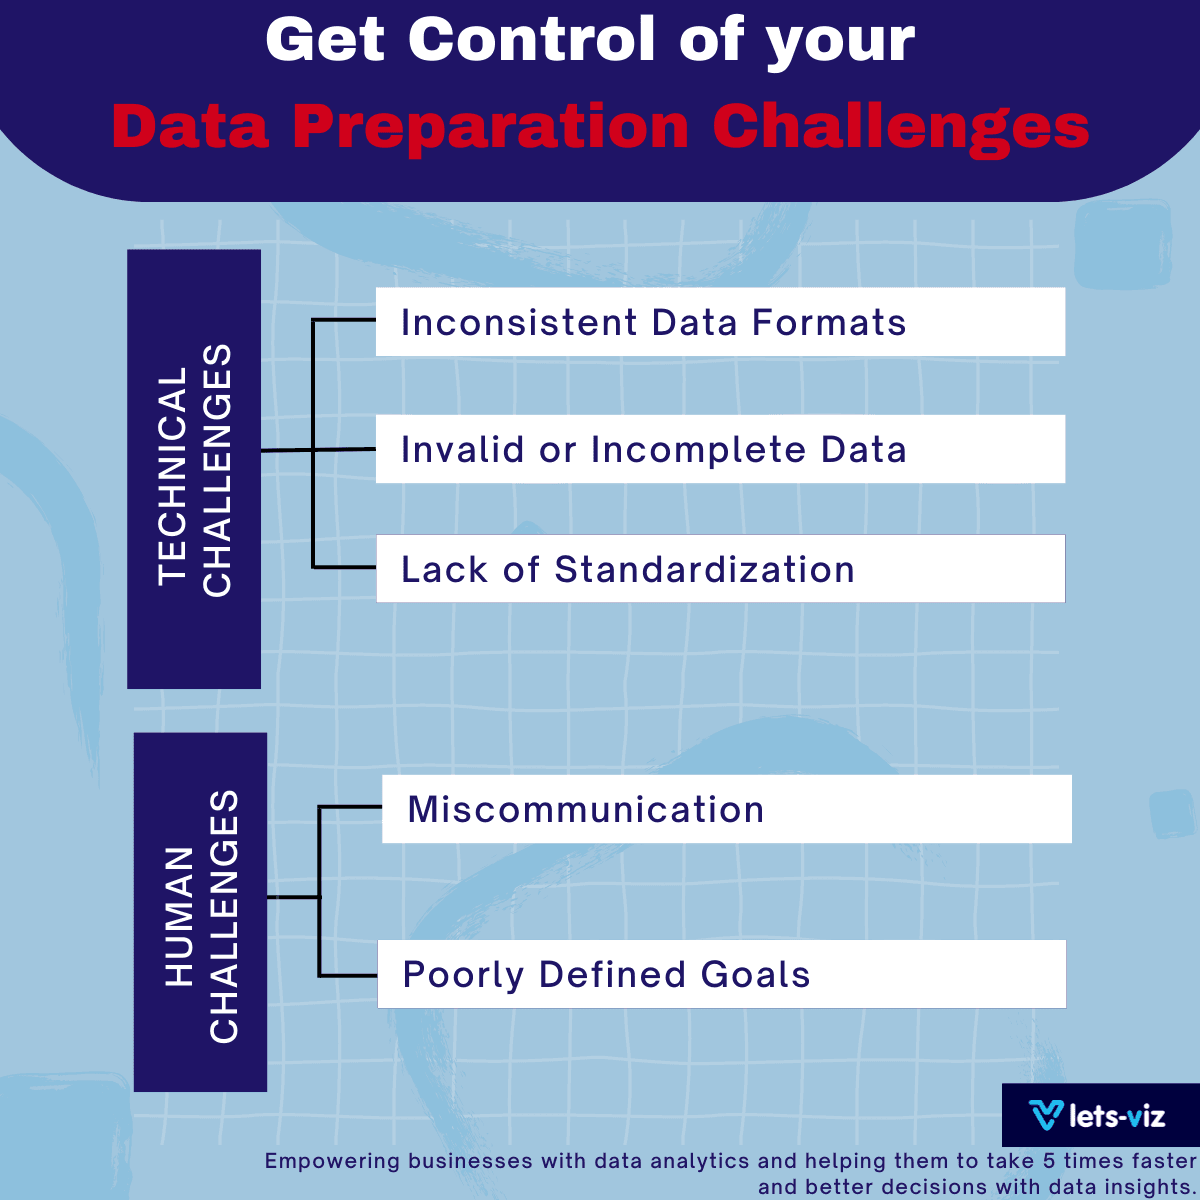
Data preparation challenges can be divided into two broad categories: technical challenges and human challenges.
Technical Challenges:
Inconsistent Data Formats: One of the most common technical challenges is dealing with inconsistent data formats. This can happen when data is collected from multiple sources, each of which uses a different format.
For example: one source may use dates in the format dd/mm/yyyy while another source uses mm/dd/yyyy. This can make it very difficult to reconcile the two datasets.
Solution: One way to overcome this challenge is to use a tool that can automatically detect and correct inconsistencies in data format.
Invalid or Incomplete Data: Another common technical challenge is dealing with invalid or incomplete data. This happens when data is incorrectly entered or not entered at all.
For example, a field that is supposed to contain a numeric value may instead contain alphabetical characters or symbols. Invalid or incomplete data can make it very difficult to generate accurate results from your analysis.
Solution: One way to overcome this challenge is to use a tool that can automatically detect and correct errors in data entry.
Lack of Standardization: A lack of standardization is another common technical challenge that can make data preparation very difficult. This happens when there is no agreed-upon standards for how certain things should be represented in the data.
For example, there may be no agreed-upon standard for how names should be spelled or how addresses should be formatted. This lack of standardization can make it very difficult to join together different datasets.
Solution: One way to overcome this challenge is to use a tool that can automatically standardize your data according to pre-defined rules.
Human Challenges:
Miscommunication: Miscommunication is one of the most common human challenges when it comes to preparing data for analysis. It can happen when people who are working with the data do not have a clear understanding of what they are supposed to do or how they are supposed to do it. This lack of clarity can lead to errors being made in the data preparation process.
Solution: One way to overcome this challenge is to have clear and concise communication between all parties involved in the process.
Poorly Defined Goals: Another common human challenge is having poorly defined goals for the project. This can happen when people who are working on the project do not have a clear understanding of what they are trying to achieve with their analysis. Without well-defined goals, it can be very difficult to prepare accurate and actionable insights from your data analysis.
Solution: One way you can overcome this challenge is by setting clear and achievable goals for your project before you begin your analysis.
Overcoming data preparation challenges with the help of an experienced partner can make all the difference. At Let’s-Viz, we have over 10+ years of experience preparing data for analytics, and we can help you get the insights you need to make better decisions for your business.
Check out other useful Tableau charts below:
- What are the different types of Data Analysis?
- Choosing the Right BI tool – Follow these major guidelines
- How to create a rounded bar chart in Tableau
- How to create a donut chart in Tableau
- Edit Table calculation in Tableau
- Switch Between YoY and MoM using Parameter Selection
- Add Map Layers in Tableau
- Create and synchronize dual axis in Tableau
Follow us on Twitter, Facebook, Linkedin, and Tableau Public to stay updated with our latest blog and what’s new in Tableau.
If you are looking forward to get your data pipeline build and set up the dashboard for business intelligence, book a call now from here
#analytics #data #business #artificialintelligence #machinelearning #startup #deeplearning #deeplearning #datascience #ai #growth #dataanalytics #india #datascientist #powerbi #dataanalysis #tableau #businessanalytics #businessanalyst #businessandmanagement #dataanalyst #businessanalysis #analyst #analysis #powerbideveloper #powerbidesktop #letsviz