In this blog, we are going to discuss Power BI advantage over Tableau. The definition of both tools is something like this.
Power BI
Power BI is a business intelligence and data visualization tool that enables you to transform data from many sources into interactive dashboards and BI reports. It does this by allowing you to see the data. It also provides a number of software connectors and services. Microsoft Power BI is a business intelligence application that allows you to manage data from many sources and visualize it once it has been cleansed and merged. Furthermore, it allows users to make ad hoc reports, a useful tool for data analysis.
Tableau
Tableau is a powerful data visualization application that is frequently used in the area of business intelligence. It is also the product with the fastest pace of growth. It allows you to turn raw data into a fundamental and easy-to-understand format. Tableau is a tool that speeds up the process of analyzing data and produces representations in the form of dashboards and spreadsheets. This makes it easy for specialists at any firm level to understand the data created by Tableau.

Power BI Advantages Over Tableau
Power Bi and Tableau are the top solutions on the market for business intelligence and data visualization. Data analysts are often perplexed by the contrast between Power BI versus Tableau.
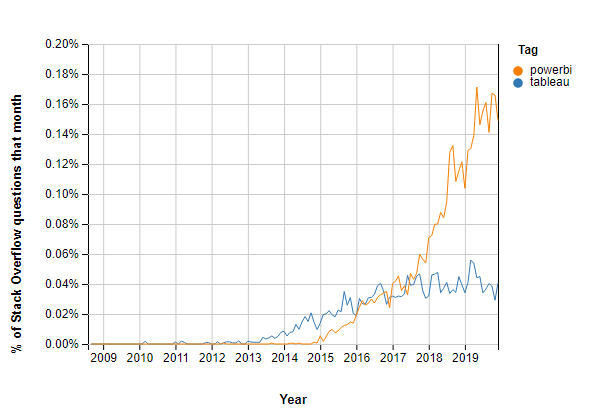
Since their start, both programs have progressed tremendously.
Many data specialists have been grappling with this quandary for quite some time. Let’s compare two sophisticated data visualization technologies – Power BI and Tableau – to make an informed decision.
- Power BI vs. Tableau price
Power BI vs. Tableau pricing is a no-brainer. Power BI Pro resembles Tableau Creator for people. PowerBI is much cheaper than Tableau. The corporate editions of these BI tools cost much more. Tableau Creator is very expensive compared to PowerBi Pro. Tableau is sold per user, but PowerBI is available with Office 365 or separately.
- Power BI/Tableau integration
Microsoft Power BI integrates with Office 365 by default. Office 365 Enterprise E5, which supports Office, Exchange, OneDrive, and SharePoint, includes Power BI. Power BI can leverage Office 365 data and analytics functions. It may be used solo or as part of a process to exploit organization-level dependencies from several data sources without scripting. Tableau has little extensibility with popular products.
- Power BI and Tableau data manipulation
Data visualization is crucial to corporate intelligence. Power BI allows data wrangling during report generation or data import. Power BI speeds up data exploration and presentation. So Power BI outperforms Tableau.
Tableau, however, can turn data into useful insights with stunning images. With a few clicks, users may create useful dashboards and execute the ad-hoc analysis.
- Tableau vs. Power BI security
Microsoft takes product and service security seriously. Likewise, Power BI. It satisfies high-level security and compliance standards. Microsoft has always prioritized data security. Tableau is recognized for visualization, not security.
- Support—Power BI vs. Tableau
Tableau subscriptions include Standard Support. Users must conduct a Maintenance Renewal after one year. Tableau also provides Extended and Premium Support.
Power BI provides many support channels. The Power BI community offers peer-to-peer help on best practices. Pro and Premium customers may get content and administrative assistance on the Power BI Support Site. The Microsoft 365 admin center offers billing and corporate support. Dedicated phone numbers can fix most issues.
Power BI and Tableau serve users similarly. Tableau’s premium support packages make a difference.
As you can see, business intelligence has a lot to offer businesses of all sizes across all industries. If you’re not already using BI in your decision-making process, now is the time to start!
Check out other helpful Power BI Blogs
- What are the different types of Data Analysis?
- Choosing the Right BI tool – Follow these major guidelines
Follow us on Twitter, Facebook, Linkedin to stay updated with our latest blog and what’s new in Power BI.

If you are looking forward to getting your data pipeline built and setting up the dashboard for business intelligence, book a call now from here.