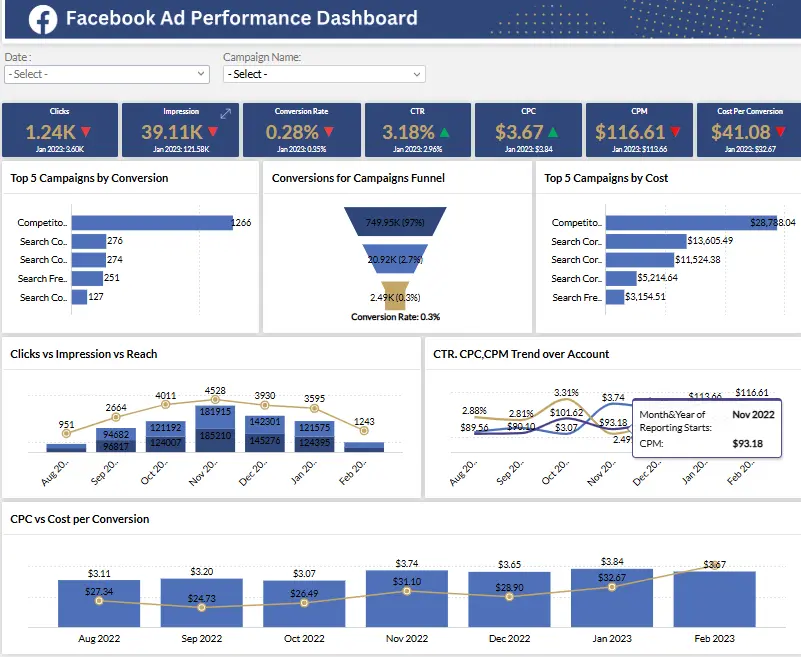
Facebook Ad Performance Dashboard
Unlock success with the Facebook Ads Dashboard! Track impressions, clicks, and conversions in real-time. Optimize your ad strategy, boost engagement, and maximize ROI—all from one powerful, intuitive dashboard. Elevate your Facebook advertising game today!
What major problems do Facebook Ad Performance Dashboards solve?
Tracking Ad Performance in Real-Time
Facebook Ads Dashboards provide live, up-to-date insights into how your campaigns are performing. This allows advertisers to monitor key metrics like clicks, impressions, and conversions as they happen, ensuring quick adjustments to boost performance.
Centralized Data Management
Instead of switching between multiple tabs or platforms, dashboards offer a unified view of all your campaign data. This helps you avoid confusion and saves time by centralizing important metrics in one place.
Improved Decision Making
With detailed data at your fingertips, dashboards enable better decision-making. By tracking performance trends and understanding what’s working or not, advertisers can make informed decisions to optimize their campaigns for maximum ROI.
Cost Efficiency Monitoring
Understanding ad spend is crucial. Dashboards allow you to track your budget and ad spend closely, helping you prevent overspending. You can see exactly where your money is going and allocate it to the best-performing ads.
User-Friendly Interface
Facebook Ads Dashboards are designed with ease of use in mind. Even if you’re not a tech expert, you can navigate the platform and understand the metrics with minimal effort. This helps streamline the learning curve for new users.
Tracking Return on Investment (ROI)
A major challenge for advertisers is understanding how their ad spend translates into revenue. Facebook Ads Dashboards simplify ROI tracking by calculating the exact return from each campaign, helping businesses measure their ad spend’s effectiveness.
Drill - down into this Customise Marketing Facebook Ad Performance
Key Performance Indicator Trends and Insights
Clicks
Total number of times users click on your Facebook ads, indicating interest and engagement potential.
CRM (Customer Relationship Management)
Effectiveness of managing interactions with potential and current customers, influencing campaign success.
Impressions
Total number of times your Facebook ads are displayed, reflecting the reach and visibility of your campaigns.
Cost Per Conversion
Average cost of achieving a conversion through your ads, indicating the efficiency of your advertising spend.
CTR (Click-Through Rate)
Percentage of clicks relative to impressions, gauging the ad's ability to attract user interactions.
Conversion Rate
Percentage of ad interactions leading to conversions, measuring the effectiveness of your ads in achieving goals.
CPC (Cost Per Click)
Average cost incurred for each click on your Facebook ads, indicating ad spend efficiency.
Campaign by Cost
Analysis of costs across different campaigns, helping optimize budget allocation and improve ROI.
Interactive Marketing Dashboards
Interactive Marketing Dashboard
Google Console Overview
Are you investing on paid channels? Paid search, social media ads, display, retargeting, affiliate marketing... This Google Console Overview dashboard gives you a clear overview of your ad spend vs budget, CTR, conversions, CPL over time per channel, source, and campaign.
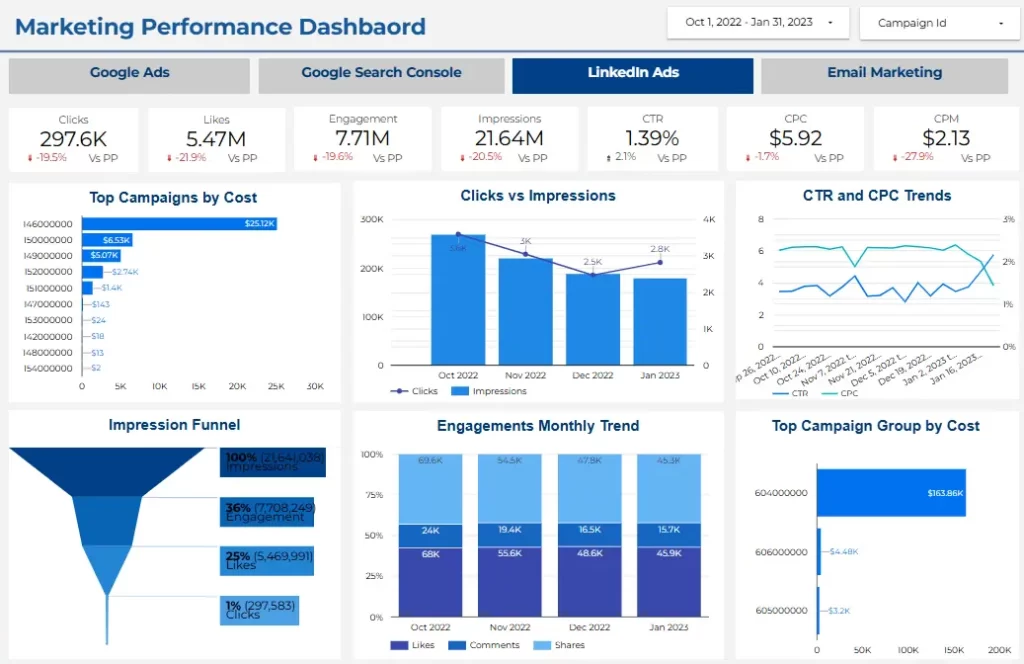
Marketing Performance Overview
Are you struggling to manage your multiple Ads Campaign Platform ?
This Marketing Performance Dashboard help you to combined all the platform Clicks , Likes , Engagement , Impressions , Top Campaign by cost , Click vs Impression , Impression Funnel etc....
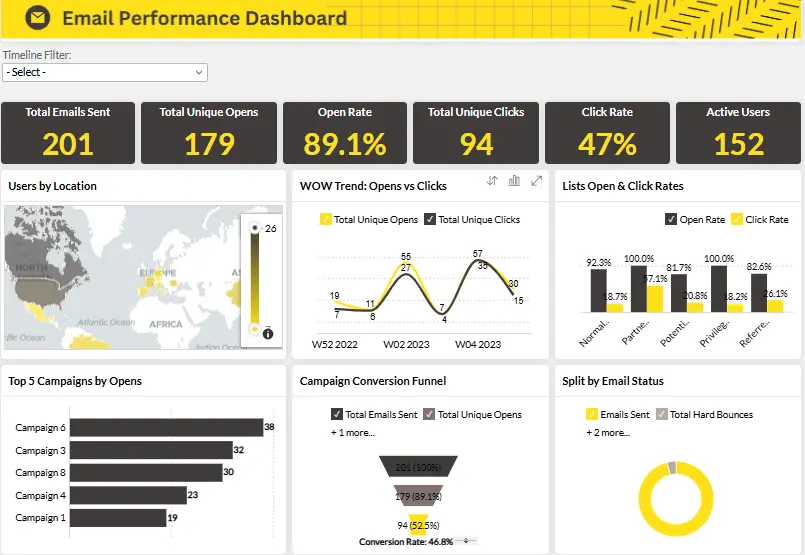
Email Performance
Are you struggling to manage your email performance .This Email Performance Dashboard
has context menu help you Measure clicks, bounces, email delivery rate, and engagement rate of your marketing email campaigns in a simple, easy-to-read dashboard. Compare performance over time to double-dip on your winning sequences.
Frequently Asked Questions
A Facebook Ads Performance Dashboard is a tool that helps advertisers track, analyze, and optimize the performance of their Facebook ad campaigns by providing real-time data and insights in one central place.
The dashboard allows you to track a variety of key metrics, such as impressions, clicks, conversions, click-through rate (CTR), cost per click (CPC), return on ad spend (ROAS), and more.
Yes, the dashboard provides historical data, allowing you to view performance trends over time. You can adjust the time range to analyze past campaign performance and identify patterns.
Yes, the dashboard offers customization options, allowing you to create reports based on specific metrics that matter most to your business goals. You can filter, sort, and group data as needed.
You can generate detailed performance reports, including campaign summaries, ad performance breakdowns, audience insights, and conversion tracking, all in easy-to-read formats.
Absolutely. The dashboard allows you to track your ad budget, daily spend, and total expenditure. You can set budget limits and monitor real-time spend to avoid overspending.
Helping companies make data-driven decisions to achieve their Goals
Experience superior data analysis with our custom dashboards. Specializing in all tools and technologies, we turn data into visually compelling, actionable insights
Helping thousands of data-driven companies to achieve their target Goals
Experience superior data analysis with our custom dashboards. Specializing in all tools and technologies, we turn data into visually compelling, actionable insights
Established in 2020, Lets Viz Technologies provides a full range of high-quality data analysis and data visualization services. We are also an authorized Zoho Partner.
Sitelinks