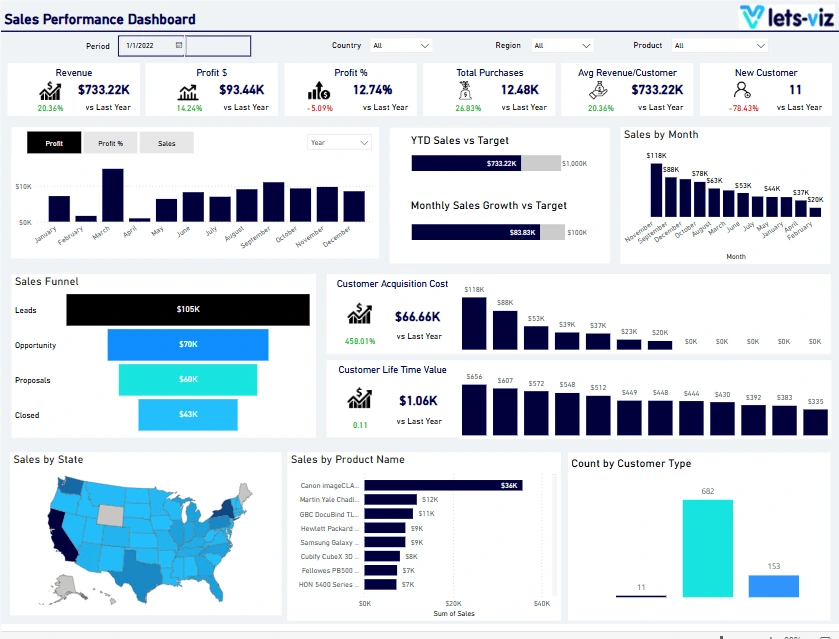
Sales Performance Dashboard
Achieve revenue growth with our proactive Power BI Sales Dashboard. Visualize sales trends, analyze customer demographics, and identify cross-selling opportunities. Harness actionable insights to prioritize leads, nurture prospects, and close deals effectively.
Maximize your sales effectiveness with our strategic Power BI Sales Dashboard. Monitor sales KPIs, assess team performance, and track sales targets in real-time. Gain insights to refine strategies, allocate resources efficiently, and drive sustainable sales growth
What major problems do Sales Dashboards solve?
Inconsistent Data Across Sales Teams
Sales dashboards provide a unified view of sales data, ensuring consistent insights across the entire team, eliminating discrepancies that can hinder decision-making.
Difficulty in Identifying Key Sales Trends
Sales Dashboard , advanced data visualization tools help identify patterns in sales trends, allowing businesses to quickly adapt their strategies based on insights.
Limited Customization in Reports
It enables users to customize dashboards to meet specific needs, ensuring that sales data is presented in the most meaningful and actionable way possible.
Inability to Track Profitability Trends
Sales Dashboard provides real-time insights into sales, profit, and profit ratios, enabling businesses to track profitability over time. This helps identify whether profit margins are increasing or decreasing and what actions need to be taken.
Challenges in Measuring Overall Sales Effectiveness
Sales Dashboard integrates key metrics such as Sales Volume, Profit, and Profit Ratio, giving businesses a clear view of sales effectiveness. Teams can identify if increased sales are translating to increased profits or if sales volume is being driven by low-margin products.
Difficulty Identifying High-Cost Customer Segments
Sales Dashboard helps segment customers based on shipping costs and product quantity, making it easier to identify customer segments where shipping costs are particularly high or profits are lower, enabling businesses to adjust strategies accordingly.
Drill - down into this Customise Marketing Sales Performance Dashboard

Key Performance Indicator Trends and Insights

Revenue
Total income generated from sales, indicating overall business performance and market demand.

Total Purchase
Total number of transactions completed, indicating sales volume and customer activity.

Profit
Total earnings after deducting all expenses, reflecting the financial success and sustainability of sales activities.

New Customer
Number of new customers acquired, reflecting growth and effectiveness of sales strategies in expanding the customer base.

Profit %
Percentage of profit relative to revenue, measuring profitability and cost efficiency in sales operations.

Average Revenue per Customer
Average income generated from each customer, providing insights into customer value and spending behavior.
Frequently Asked Questions
The Sales Dashboard is designed to provide businesses with real-time insights into key sales metrics, including sales, profit, profit ratio, quantity sold, and shipping costs. It helps you make data-driven decisions to optimize performance and profitability.
The dashboard allows you to track essential KPIs, identify trends, and pinpoint areas that need improvement. By monitoring sales, profit, and other metrics, you can make informed decisions to boost efficiency and increase revenue.
The Sales Dashboard tracks key performance indicators (KPIs) such as sales, profit, profit ratio, quantity sold, and shipping costs. These metrics are vital for understanding your business’s financial health and operational efficiency.
The Profit Ratio is the percentage of profit in relation to sales. It helps you understand how efficiently your business is converting sales into profits. A higher profit ratio means better financial performance and operational efficiency.
Yes, the Sales Dashboard allows you to filter data by various time periods, such as daily, weekly, monthly, or custom ranges. This feature lets you analyze trends and performance over time for more detailed insights.
Yes, the Sales Dashboard is highly customizable. You can tailor it to include other metrics or KPIs that are specific to your business needs. This ensures that the dashboard provides the most relevant and actionable insights.
Helping companies make data-driven decisions to achieve their Goals
Experience superior data analysis with our custom dashboards. Specializing in all tools and technologies, we turn data into visually compelling, actionable insights

Helping thousands of data-driven companies to achieve their target Goals
Experience superior data analysis with our custom dashboards. Specializing in all tools and technologies, we turn data into visually compelling, actionable insights
Established in 2020, Lets Viz Technologies provides a full range of high-quality data analysis and data visualization services. We are also an authorized Zoho Partner.
Sitelinks