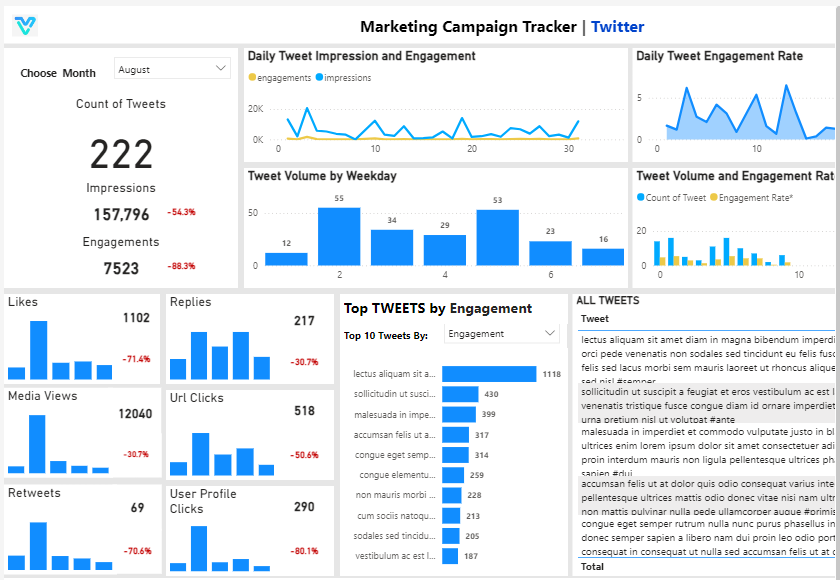
Impressions
Total number of times your content is displayed, indicating reach and visibility of your posts.
Optimize your Twitter marketing campaigns with our dynamic Power BI Dashboard. Analyze key performance indicators, track follower growth, and refine your content strategy. Gain comprehensive insights to enhance engagement and drive results.Supercharge your Twitter marketing with our Power BI Dashboard. Visualize engagement metrics, analyze follower behavior, and optimize your content. Gain powerful insights to drive targeted engagement and boost your social media presence.
Track impressions, retweets, engagement, replies, likes, URL clicks, media views, and profile clicks in one Power BI Twitter marketing view.
Built in Power BI for Twitter marketing teams with live social KPI tracking and engagement drill-down analysis.
Explore the core Power BI Twitter marketing dashboard views built for social engagement and content performance decisions.
Interactive Power BI Twitter marketing reporting view.
Open the live embedded Power BI Twitter marketing dashboard directly in a fullscreen modal.
Track impressions, retweets, engagement, replies, likes, URL clicks, media views, and user profile clicks in one place.
Total number of times your content is displayed, indicating reach and visibility of your posts.
Number of times users share your posts, reflecting content virality and extended reach on social platforms.
Overall interactions (likes, comments, shares) with your content, reflecting audience interest and involvement.
Number of comments or replies on your posts, indicating user engagement and interaction with your content.
Number of likes your posts receive, showcasing content appeal and positive reception from the audience.
Total clicks on links within your posts, measuring the effectiveness of your content in driving traffic to external sites.
Total number of views on media content (images, videos), indicating the effectiveness of visual content in engaging users.
Number of times users click on your profile, indicating interest in your brand and potential for follower growth.
These are the practical Twitter marketing challenges this dashboard helps teams resolve.
Without a centralized Twitter dashboard, teams struggle to understand how widely posts are being seen and which content is actually building visibility.
When likes, retweets, replies, and overall engagement are spread across manual reports, it becomes harder to identify what content is truly resonating with the audience.
Without URL click tracking in one place, teams cannot quickly tell which tweets are generating meaningful traffic and which messages need optimization.
Metrics such as media views and user profile clicks help reveal audience intent, but scattered reporting makes that signal difficult to monitor consistently.
Delayed reporting slows down content iteration and prevents teams from reacting quickly to performance shifts across campaigns and posting strategies.
A unified Twitter marketing dashboard brings reach, engagement, and click metrics into one Power BI view so teams can make faster and more confident decisions.
Key Details
Key Twitter marketing dashboard capabilities with context from the source page.
Track impressions and media visibility in one Power BI dashboard to understand how far each Twitter campaign is spreading.
Retweets, replies, likes, and overall engagement can be reviewed together so teams can quickly spot what content is performing well.
URL clicks show which posts are moving users toward landing pages, offers, or campaign destinations.
User profile clicks help reveal brand curiosity and indicate which content is generating stronger audience interest.
How this dashboard helps teams move from scattered Twitter reporting to faster, data-backed content and engagement decisions.
Marketing teams often struggle with scattered Twitter metrics, delayed engagement reporting, and limited visibility into which content is driving reach and clicks.
This dashboard centralizes Twitter reach, engagement, and click-performance KPIs in one Power BI view for faster social marketing decisions.
Find answers to common questions about this Twitter marketing dashboard.
It centralizes Twitter performance metrics into one reporting view so teams can monitor reach, engagement, clicks, and audience behavior more efficiently.
Experience superior data analysis with our custom dashboards. Specializing in all tools and technologies, we turn data into visually compelling, actionable insights
NDA-safeNo obligationClear next steps
This page was seeded from WordPress + Yoast data and mapped to your Sanity dashboard schema.