Clicks
Total number of times users click on your LinkedIn ads, indicating interest and potential for conversion.
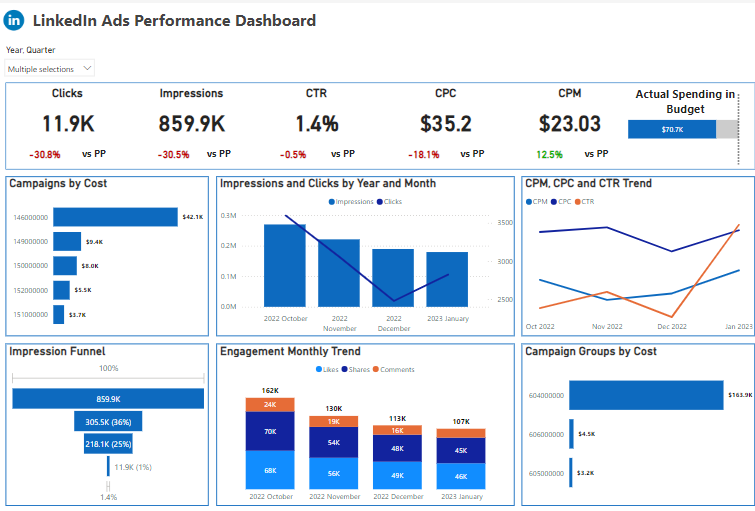
Achieve LinkedIn advertising excellence with our Power BI Dashboard. Track campaign metrics, analyze demographic data, and fine-tune your ad strategies. Gain actionable insights to drive higher engagement and maximize ad performance.Boost your LinkedIn ad campaigns with our Power BI Ads Dashboard. Monitor engagement rates, evaluate ad spend efficiency, and uncover audience trends. Use data-driven insights to refine strategies and achieve superior advertising results.
Track clicks, CPC, impressions, CPM, CTR, and engagement trends in one Power BI LinkedIn ads view.
Built in Power BI for LinkedIn ads teams with live campaign KPI tracking and spend-efficiency drill-down analysis.
Explore the core Power BI LinkedIn ads dashboard views built for campaign and media-efficiency decisions.
Interactive Power BI LinkedIn ads reporting view.
Open the live embedded Power BI LinkedIn ads dashboard directly in a fullscreen modal.
Track clicks, CPC, impressions, CPM, CTR, and engagement trends in one place.
Total number of times users click on your LinkedIn ads, indicating interest and potential for conversion.
Average cost incurred for each click on your LinkedIn ads, indicating ad spend efficiency.
Total number of times your LinkedIn ads are displayed, reflecting the reach and visibility of your campaigns.
Cost of generating one thousand ad impressions, helping optimize budget allocation.
Percentage of ad clicks relative to impressions, measuring ad effectiveness in driving traffic.
Analysis of user interactions (likes, comments, shares) with your ads over time, providing insights into engagement patterns and campaign performance.
These are the practical LinkedIn advertising challenges this dashboard helps teams resolve.
Comparing the performance of different campaigns can be difficult without a unified system. Dashboards provide side-by-side comparisons of various campaigns, helping to identify trends and areas for improvement.
LinkedIn Ad Performance Dashboards provide real-time performance metrics, helping businesses stay on top of their campaigns. Without this, advertisers would have to rely on outdated or delayed data, leading to missed opportunities.
Managing multiple LinkedIn ad campaigns simultaneously can be overwhelming. Dashboards allow marketers to track the performance of each campaign in one place, simplifying the management process.
Conversion tracking is vital to determine whether ads are leading to desired actions (such as sign-ups, purchases, or other engagements). LinkedIn Ad Performance Dashboards make conversion tracking easier and more accurate.
With quick access to detailed metrics and performance data, LinkedIn Ad Performance Dashboards help businesses make faster, data-driven decisions. This agility helps brands stay competitive and responsive in a fast-paced digital advertising environment.
Without proper organization, large amounts of data can become overwhelming. Dashboards present information in an organized, easy-to-understand format, helping marketers focus on what matters most.
Key Details
Key LinkedIn ads dashboard capabilities with context from the source page.
Clicks and impressions show how effectively LinkedIn campaigns are generating attention and driving interest across target audiences.
CPC and CPM help teams understand media cost efficiency and identify where budget allocation can be improved.
A single Power BI view makes it easier to compare campaigns side by side and spot trends that need action.
Engagement trend monitoring helps marketers evaluate whether ad creatives and audience targeting are improving over time.
How this dashboard helps teams move from fragmented LinkedIn advertising reports to faster media and campaign decisions.
Marketing teams often struggle with delayed campaign visibility, fragmented LinkedIn ad metrics, and unclear media-efficiency trends across campaigns.
This dashboard centralizes LinkedIn ads KPIs such as clicks, CPC, CPM, CTR, impressions, and engagement trends in one Power BI view for faster media decisions.
Find answers to common questions about this LinkedIn ads dashboard.
A LinkedIn Ad Performance Dashboard is a tool that provides detailed insights into the performance of your LinkedIn ad campaigns. It allows you to track key metrics like impressions, clicks, conversions, and ROI in real-time.
Experience superior data analysis with our custom dashboards. Specializing in all tools and technologies, we turn data into visually compelling, actionable insights
NDA-safeNo obligationClear next steps
This page was seeded from WordPress + Yoast data and mapped to your Sanity dashboard schema.