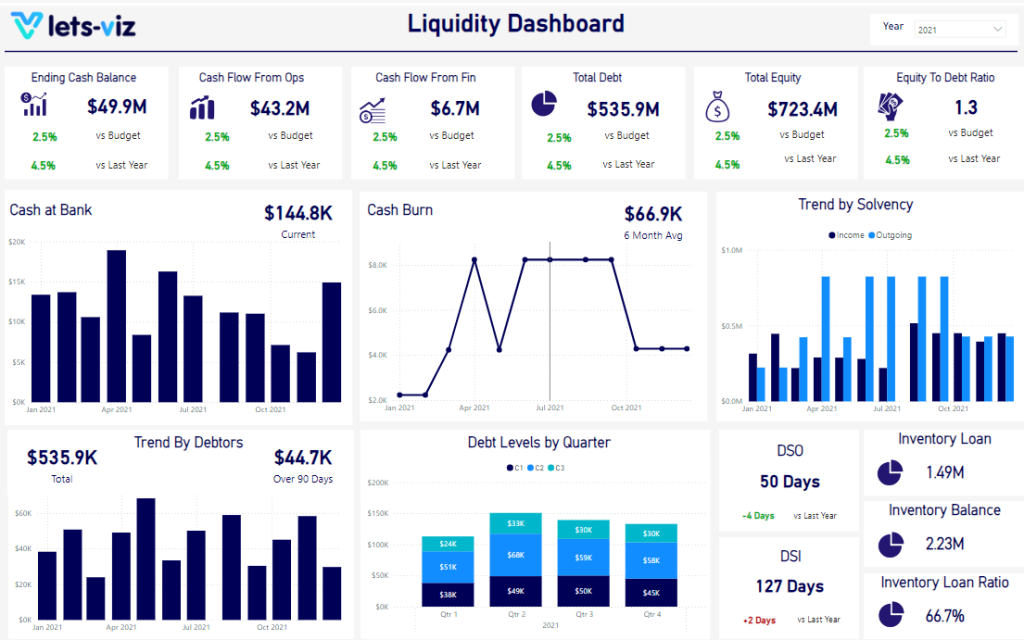
Financial Liquidity Dashboard
Gain a competitive edge with our Power BI Liquidity Finance Dashboard. Track ending cash balance, visualize cash flow patterns, manage total debt, and optimize equity-to-debt ratio. Harness actionable insights to maintain liquidity and drive business growth in dynamic markets.
Drill - down into this Customise Marketing Financial Liquidity Dashboard
Key Performance Indicator Trends and Insights
Ending Cash Balance
Total cash available at the end of a period, indicating liquidity and the ability to meet short-term obligations.
Total Debt
Aggregate amount of all outstanding debts, showing the company’s leverage and financial obligations.
Cash Flow from Operations (Ops)
Net cash generated from operating activities, reflecting the core business profitability and operational efficiency.
Total Equity
Total value of shareholder equity, indicating the net worth and financial strength of the company.
Cash Flow from Financing (Fin)
Net cash flow from financing activities, indicating the impact of debt, equity transactions, and dividends on liquidity.
Equity to Debt Ratio
Ratio of total equity to total debt, measuring financial leverage and stability, and assessing the risk level of the company’s capital structure.
For Live Dashboard Experience, please access this page from Desktop or a Tablelt
Helping companies make data-driven decisions to achieve their Goals
Experience superior data analysis with our custom dashboards. Specializing in all tools and technologies, we turn data into visually compelling, actionable insights
Helping thousands of data-driven companies to achieve their target Goals
Experience superior data analysis with our custom dashboards. Specializing in all tools and technologies, we turn data into visually compelling, actionable insights
Established in 2020, Lets Viz Technologies provides a full range of high-quality data analysis and data visualization services. We are also an authorized Zoho Partner.
Sitelinks