Views
Total number of times your videos are watched, indicating overall content popularity and reach.
Unleash the power of your YouTube channel with our Channel Analysis dashboard. Explore key metrics, audience insights, and content performance in one sleek interface. Gain the edge in content strategy and audience engagement, driving your channel to new heights of success.
Track views, watch time, subscribers, engagement, and content performance in one Looker Studio YouTube insights view.
Built in Looker Studio with YouTube insights KPI tracking for views, watch time, subscribers, and engagement.
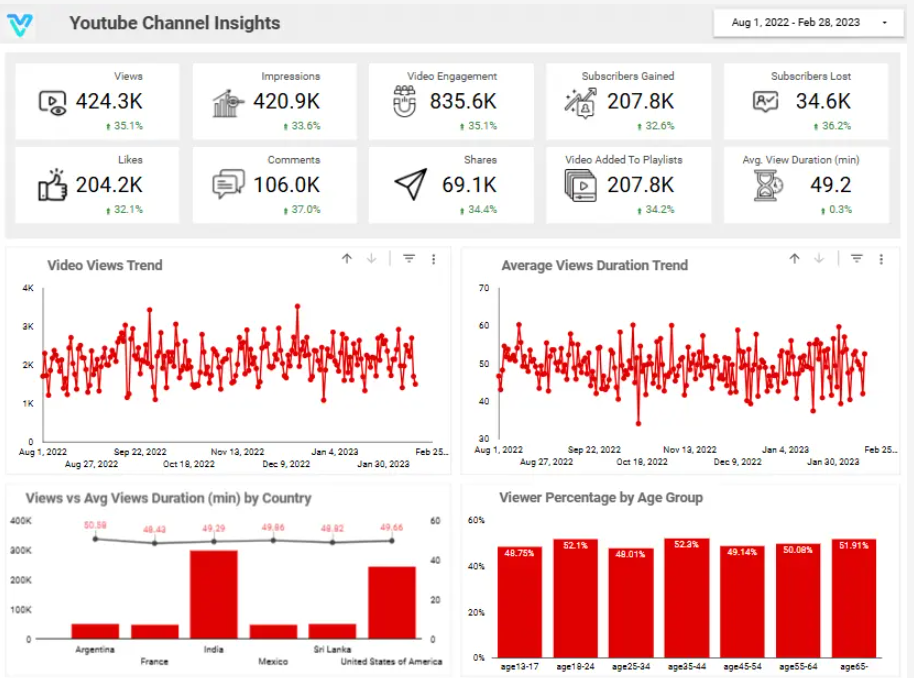
Explore the core Looker Studio YouTube insights dashboard views built for video performance decisions.
Interactive Looker Studio YouTube insights reporting view.
Open the live embedded Looker Studio YouTube insight dashboard directly in a fullscreen modal.
Track views, watch time, subscribers, engagement, and content performance in one Looker Studio view.
Total number of times your videos are watched, indicating overall content popularity and reach.
Number of likes your videos receive, showcasing viewer appreciation and positive feedback.
Number of times your video thumbnails are shown to viewers, reflecting the visibility of your content.
Number of subscribers lost over a specific period, helping identify potential content issues.
Total interactions (likes, comments, shares) on your videos, measuring audience involvement and interest.
Number of comments on your videos, indicating viewer engagement and interaction.
These are the practical YouTube reporting challenges this dashboard helps teams resolve.
The dashboard provides detailed analytics about each video’s views, likes, comments, and shares. This helps content creators see which videos resonate with their audience and optimize future content accordingly.
By analyzing the age, gender, location, and interests of viewers, the dashboard helps creators tailor content to their target audience, boosting engagement and relevance.
The dashboard shows how long viewers are watching your videos. This is crucial for understanding where people lose interest and optimizing video length and content flow to maintain viewer attention.
You can track subscriber count and watch time growth over time. This helps in identifying trends, growth patterns, and the impact of certain content strategies.
It highlights where your views are coming from – whether it’s search results, external websites, or social media. This helps creators focus on strategies that work best for attracting new viewers.
The insights dashboard helps in turning raw data into actionable insights. It empowers creators to make informed decisions on content creation, marketing strategies, and video optimization for better results.
Key Details
Key YouTube insights dashboard capabilities with context from the source page.
Total number of times your videos are watched, indicating overall content popularity and reach.
Number of likes your videos receive, showcasing viewer appreciation and positive feedback.
Number of times your video thumbnails are shown to viewers, reflecting the visibility of your content.
Number of subscribers lost over a specific period, helping identify potential content issues.
Total interactions (likes, comments, shares) on your videos, measuring audience involvement and interest.
Number of comments on your videos, indicating viewer engagement and interaction.
How this dashboard helps video teams move from fragmented YouTube insights reporting to faster content and engagement decisions.
Social teams often struggle with fragmented YouTube insights reporting, delayed engagement visibility, and low confidence in content performance trends.
This Looker Studio dashboard centralizes YouTube views, watch time, subscribers, engagement, and content performance in one view for faster video decisions.
Find answers to common questions about this Looker Studio YouTube insight dashboard.
The YouTube Channel Insights Dashboard provides data-driven analytics to track video performance, audience demographics, engagement, traffic sources, and revenue, helping creators optimize their content and grow their channel.

Experience superior data analysis with our custom dashboards. Specializing in all tools and technologies, we turn data into visually compelling, actionable insights
NDA-safeNo obligationClear next steps
This page was seeded from WordPress + Yoast data and mapped to your Sanity dashboard schema.