Google Search Console Dashboard
Dominate search with our Google Search Console Dashboard! Effortlessly track impressions, clicks, CTR, and average position. Unleash insights to optimize content and skyrocket your online visibility—all in one sleek interface. Your path to search engine supremacy starts here!
What major problems do Google Search Console Dashboards solve?
Tracking Website Performance
Google Search Console Dashboards help monitor how well your website is performing in search results, giving you access to crucial metrics like clicks, impressions, and average position.
Identifying Search Queries
You can easily identify which search queries are driving traffic to your site, helping you optimize your content for high-ranking keywords that matter most.
Improving Content Strategy
By identifying high-traffic pages and underperforming content, dashboards give you insights into areas where you can improve your content strategy for better results.
Understanding Click-Through Rates (CTR)
Dashboards show how your pages are performing in terms of CTR, which helps you optimize meta descriptions, titles, and content to attract more clicks from search results.
Tracking Site Traffic Trends
The dashboards allow you to track traffic trends over time, helping you identify patterns, seasonal fluctuations, and the impact of your SEO efforts on site traffic.
Analyzing Geographic Performance
You can see how your site is performing in different countries and regions, helping you tailor your SEO strategies to specific markets or local search behavior.
Drill - down into this Customise Marketing Google Console
Key Performance Indicator Trends and Insights
Impressions
The number of times your website appears in search results, indicating visibility and potential reach.
Average Position
The average ranking of your website in search results, providing insights into visibility and competitiveness.
Clicks
Instances where users click through to your website from search results, reflecting traffic driven by search engines.
Location-wise KPI
Analysis of performance metrics segmented by geographical location, aiding in localized SEO strategies and targeting.e.
CTR (Click-Through Rate)
The percentage of clicks compared to impressions, revealing the effectiveness of your search snippets in enticing clicks.
Tabular View
A structured display of performance data in table format, facilitating easy comparison and analysis of KPIs over time and across different dimensions.
Interactive Marketing Dashboard
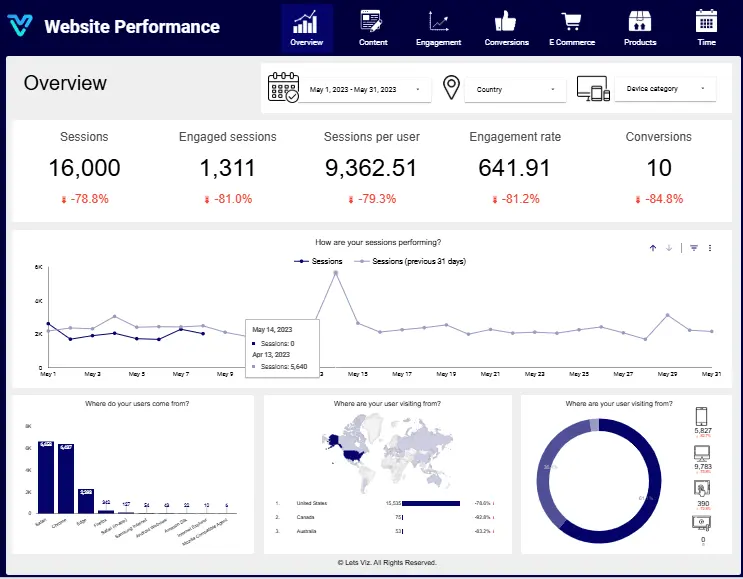
Website Performance Overview
Are You Struggling on Website Data Management ? Session , Engagement , Conversion , User status .... . This Website Performance Dashboard Gives you clear Overview of Session , Engagement , Session Per user , Total Revenue etc ......
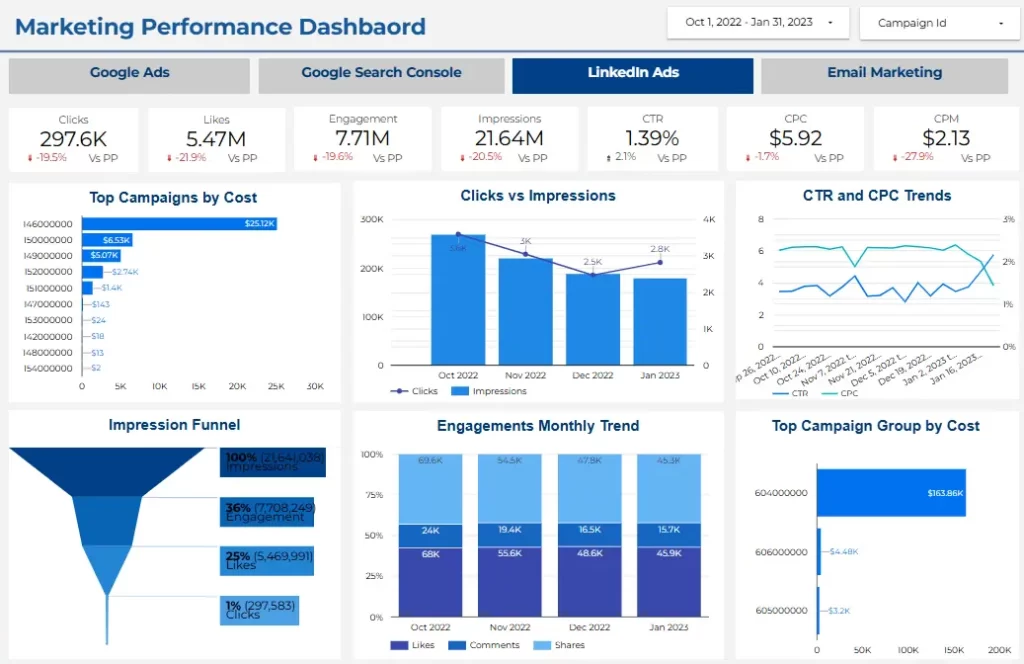
Marketing Performance Overview
Are you struggling to manage your multiple Ads Campaign Platform ? This Marketing Performance Dashboard help you to combined all the platform Clicks , Likes , Engagement , Impressions , Top Campaign by cost , Click vs Impression , Impression Funnel etc....
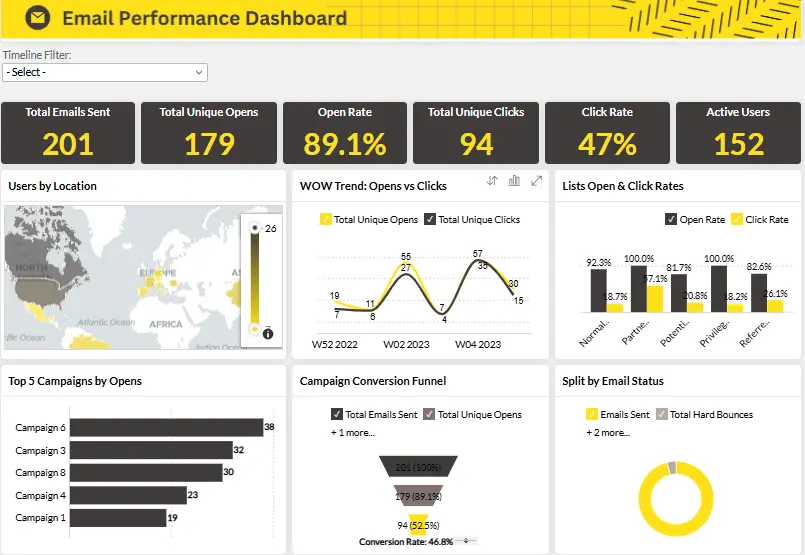
Email Performance
Are you struggling to manage your email performance .This Email Performance Dashboard help you Measure clicks, bounces, email delivery rate, and engagement rate of your marketing email campaigns in a simple, easy-to-read dashboard. Compare performance over time to double-dip on your winning sequences.
Frequently Asked Questions
The dashboard provides insights into search performance, indexing status, crawl errors, mobile usability, backlinks, security issues, and much more to help optimize your website’s presence on Google.
In the dashboard, navigate to the “Performance” tab to view key metrics such as clicks, impressions, average position, and click-through rates (CTR) for your pages and keywords.
Yes, the “Performance” report in Google Search Console allows you to see which search queries are driving traffic to your site, as well as their rankings, impressions, and click-through rates.
Yes, the “Performance” report in Google Search Console allows you to view metrics like clicks, impressions, and rankings for specific pages, helping you monitor individual page performance.
Let’s Viz GA4 Dashboards provide an in-depth breakdown of your website’s traffic sources, including organic search, paid ads, social media, referral links, and direct traffic. With these insights, you can determine which marketing channels drive the most traffic and conversions, enabling you to focus your efforts on the most effective sources and optimize your marketing campaigns accordingly.
The data in Google Search Console is updated regularly, with performance data typically updated within 1-2 days, while other sections like coverage and mobile usability may take longer to reflect changes.
Helping companies make data-driven decisions to achieve their Goals
Experience superior data analysis with our custom dashboards. Specializing in all tools and technologies, we turn data into visually compelling, actionable insights
Helping thousands of data-driven companies to achieve their target Goals
Experience superior data analysis with our custom dashboards. Specializing in all tools and technologies, we turn data into visually compelling, actionable insights
Established in 2020, Lets Viz Technologies provides a full range of high-quality data analysis and data visualization services. We are also an authorized Zoho Partner.
Sitelinks