Views
Total number of times your business listing is viewed on Google, indicating visibility and reach.
Elevate your online presence with the Google Business Dashboard! Unlock vital performance metrics, user interactions, and local search insights. Transform data into actionable strategies, boost visibility, and supercharge customer engagement. Your business growth journey starts here!
Track profile views, search impressions, actions, calls, direction requests, and reviews in one Looker Studio Google My Business view.
Built in Looker Studio with Google Business Profile KPI tracking for views, searches, actions, calls, and directions.
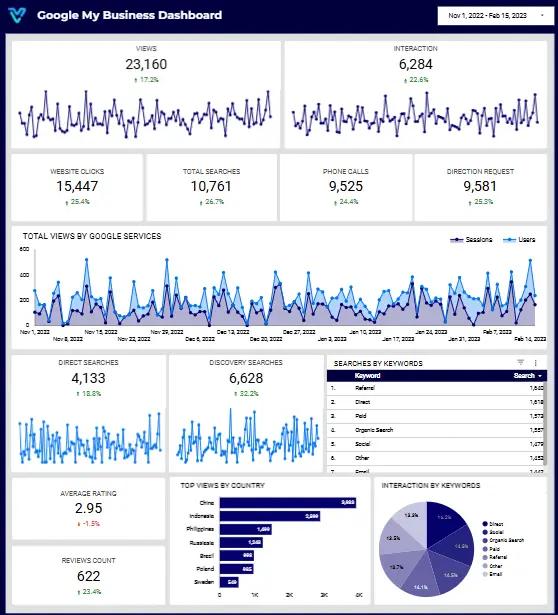
Explore the core Looker Studio Google My Business dashboard views built for local visibility decisions.
Interactive Looker Studio Google My Business reporting view.
Open the live embedded Looker Studio Google My Business dashboard directly in a fullscreen modal.
Track profile views, search impressions, actions, calls, direction requests, and review trends in one Looker Studio view.
Total number of times your business listing is viewed on Google, indicating visibility and reach.
Number of phone calls made directly from your listing, indicating customer interest and engagement..
Total engagements (clicks, calls, directions) with your listing, reflecting user interest and activity.
Number of times users request directions to your business, reflecting intent to visit.
Number of times users click through to your website from your business listing, indicating traffic driven by your listing.
The average star rating from customer reviews, reflecting overall customer satisfaction and service quality.
Total number of searches that display your business listing, showing overall search visibility.
Total number of customer reviews, providing insights into customer feedback and engagement.
These are the practical Google My Business reporting challenges this dashboard helps teams resolve.
Google My Business dashboards in Looker Studio centralize your business data, providing a single location for easy access to insights. You no longer need to toggle between multiple platforms to gather performance metrics.
A Looker Studio dashboard pulls live data from Google My Business, giving you real-time updates on performance metrics such as customer calls, website visits, and direction requests. This enables timely decision-making and swift action
With Looker Studio, you can easily create custom reports and share them with stakeholders or team members. This eliminates the need for manual data sharing and ensures everyone is on the same page when it comes to business performance.
With a Looker Studio dashboard, you can view and analyze data based on specific geographic locations. This enables you to tailor your marketing strategies based on region-specific needs and behaviors, enhancing local SEO efforts.
It highlights where your views are coming from – whether it’s search results, external websites, or social media. This helps creators focus on strategies that work best for attracting new viewers.
The insights dashboard helps in turning raw data into actionable insights. It empowers creators to make informed decisions on content creation, marketing strategies, and video optimization for better results.
Key Details
Key Google My Business dashboard capabilities with context from the source page.
Total number of times your business listing is viewed on Google, indicating visibility and reach.
Number of phone calls made directly from your listing, indicating customer interest and engagement..
Total engagements (clicks, calls, directions) with your listing, reflecting user interest and activity.
Number of times users request directions to your business, reflecting intent to visit.
Number of times users click through to your website from your business listing, indicating traffic driven by your listing.
The average star rating from customer reviews, reflecting overall customer satisfaction and service quality.
Total number of searches that display your business listing, showing overall search visibility.
Total number of customer reviews, providing insights into customer feedback and engagement.
How this dashboard helps local teams move from fragmented Google Business Profile reporting to faster location decisions.
Local teams often struggle with fragmented Google Business Profile reporting, delayed visibility into customer actions, and low confidence in local performance trends.
This Looker Studio dashboard centralizes Google Business Profile views, searches, actions, calls, and direction requests in one view for faster local decisions.
Find answers to common questions about this Looker Studio Google My Business dashboard.
The Google Business Dashboard in Looker Studio is a powerful tool designed to provide you with in-depth insights into your website’s performance. By pulling data from Google Analytics and other sources, it visually presents key metrics, helping you understand how your website is performing
Experience superior data analysis with our custom dashboards. Specializing in all tools and technologies, we turn data into visually compelling, actionable insights
NDA-safeNo obligationClear next steps
This page was seeded from WordPress + Yoast data and mapped to your Sanity dashboard schema.