
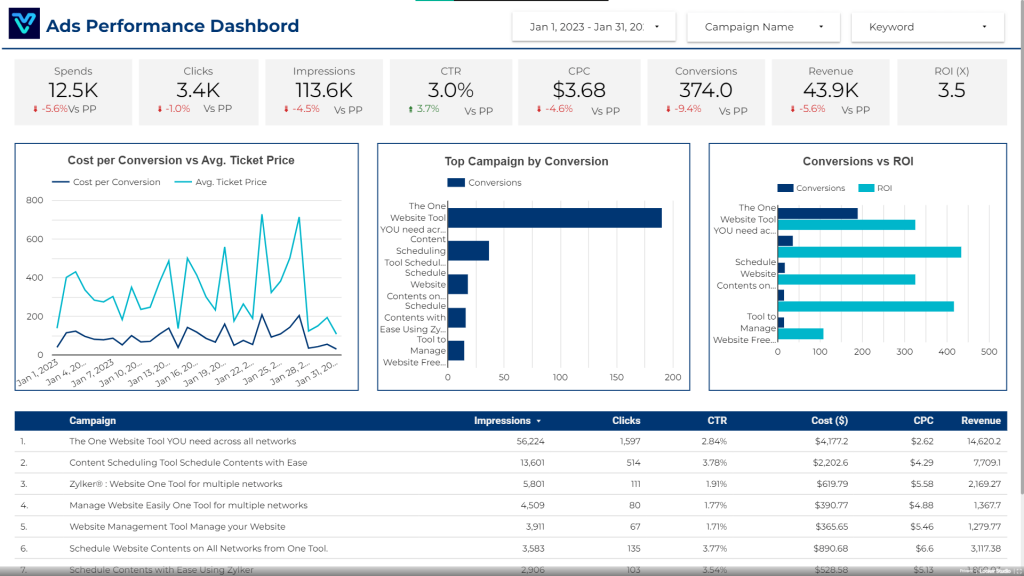
Google Ads Dashboard
Our Google Ads Dashboard offers a comprehensive overview of your ad campaigns, providing insights into key metrics like impressions, clicks, conversions, and cost. This dashboard helps you optimize ad spending, track ROI, and make data-driven decisions to improve campaign performance. It’s essential for businesses aiming to maximize their advertising efficiency and reach their target audience effectively.
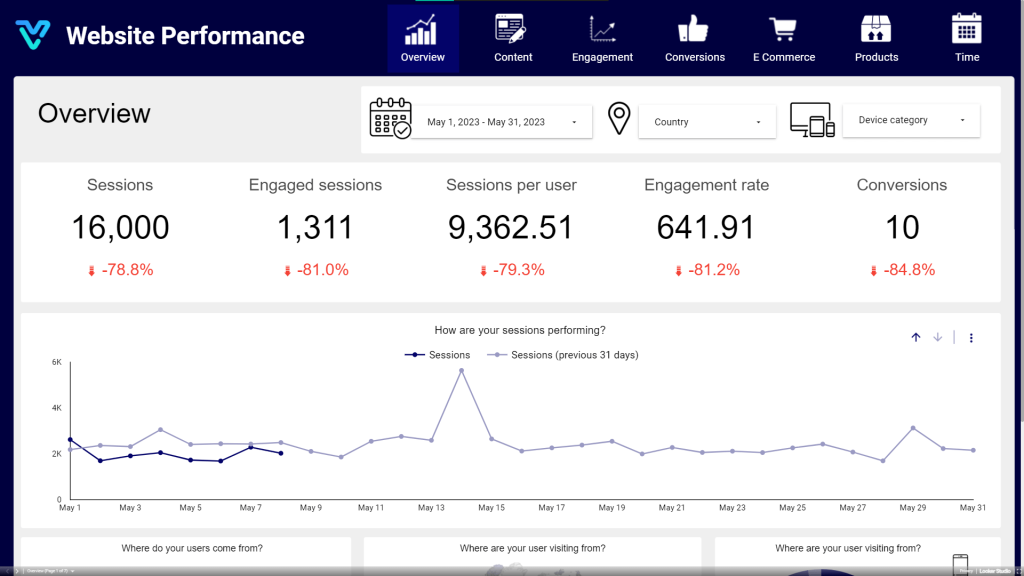
Website GA4 Dashboard
The Website GA4 Dashboard provides in-depth analytics on user behavior, traffic sources, and engagement on your website. It helps you understand how visitors interact with your site, identify high-performing content, and optimize user experiences. This dashboard is crucial for improving website performance, driving conversions, and enhancing the overall user journey.
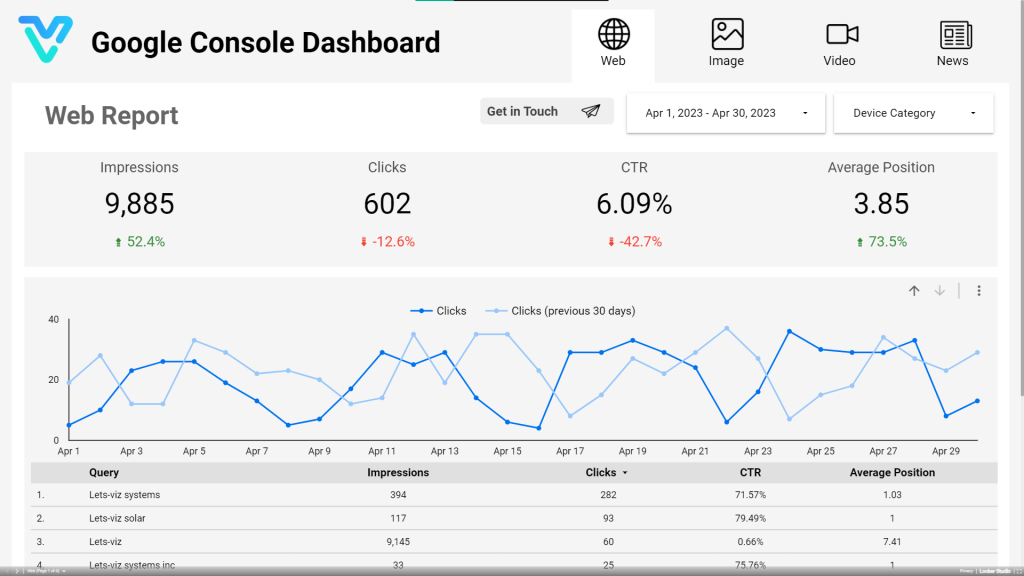
Google Search Console Dashboard
Our Google Search Console Dashboard offers valuable insights into your website's search performance, including keyword rankings, click-through rates, and indexing status. It’s designed to help you optimize your site’s visibility on Google, monitor search traffic, and troubleshoot issues. This dashboard is vital for improving SEO strategies and ensuring your content reaches the right audience.
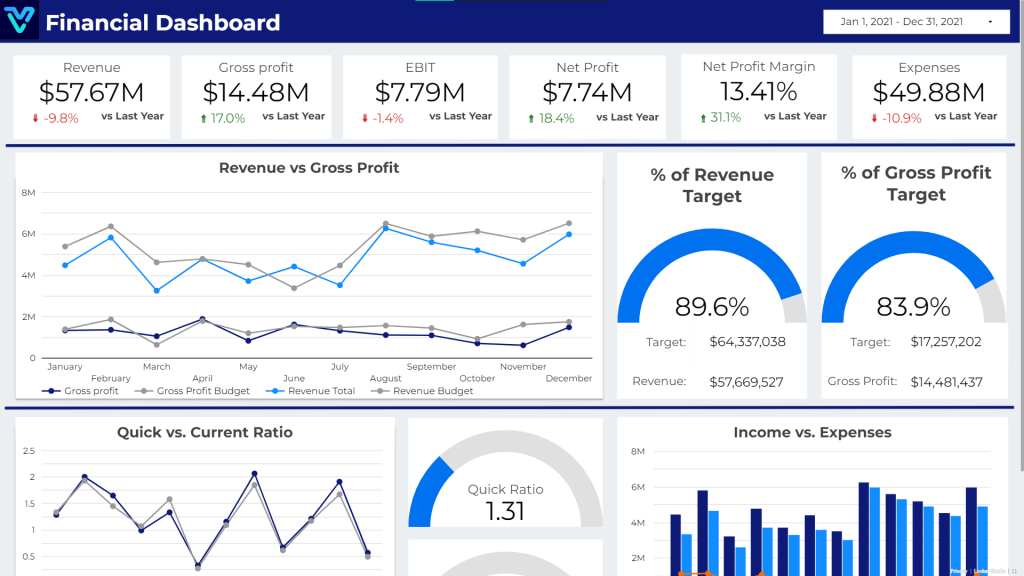
Finance Dashboard
The Finance Dashboard provides a detailed view of your company’s financial health, tracking key metrics like revenue, expenses, profit margins, and cash flow. This dashboard enables you to monitor financial performance, make informed budgeting decisions, and ensure long-term sustainability. It’s an essential tool for finance teams to maintain transparency and drive business growth.
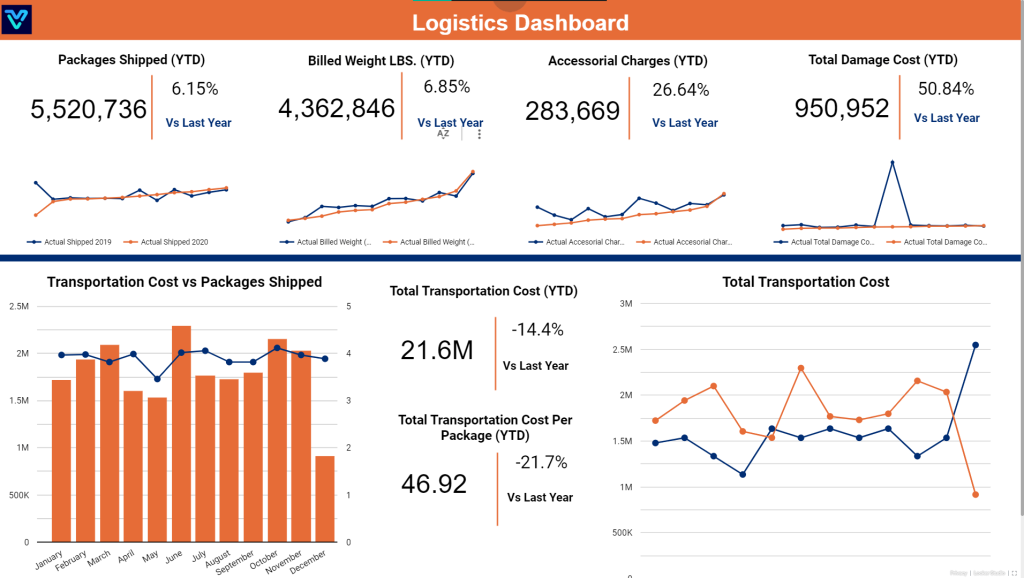
Logistics Dashboard
Our Logistics Dashboard offers real-time tracking of your supply chain operations, including inventory levels, shipment statuses, and delivery times. It helps streamline logistics processes, reduce costs, and improve delivery efficiency. This dashboard is critical for maintaining operational excellence and ensuring timely fulfillment of customer orders.
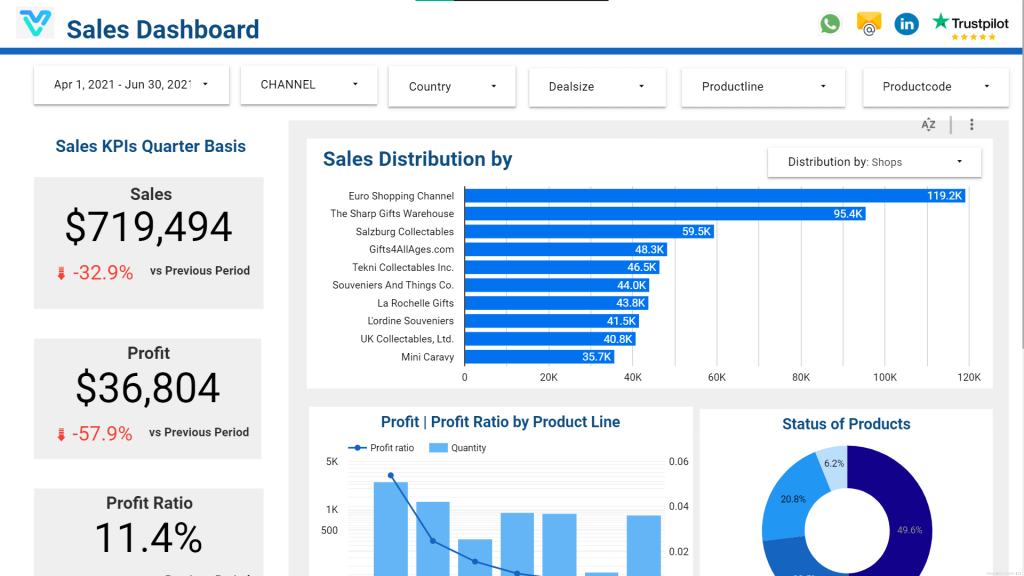
Sales Dashboard
The Sales Dashboard provides a comprehensive overview of your sales performance, tracking metrics such as sales volume, revenue, and conversion rates. It helps sales teams monitor progress, identify opportunities, and set targets for growth. This dashboard is crucial for driving sales strategies and achieving business goals.
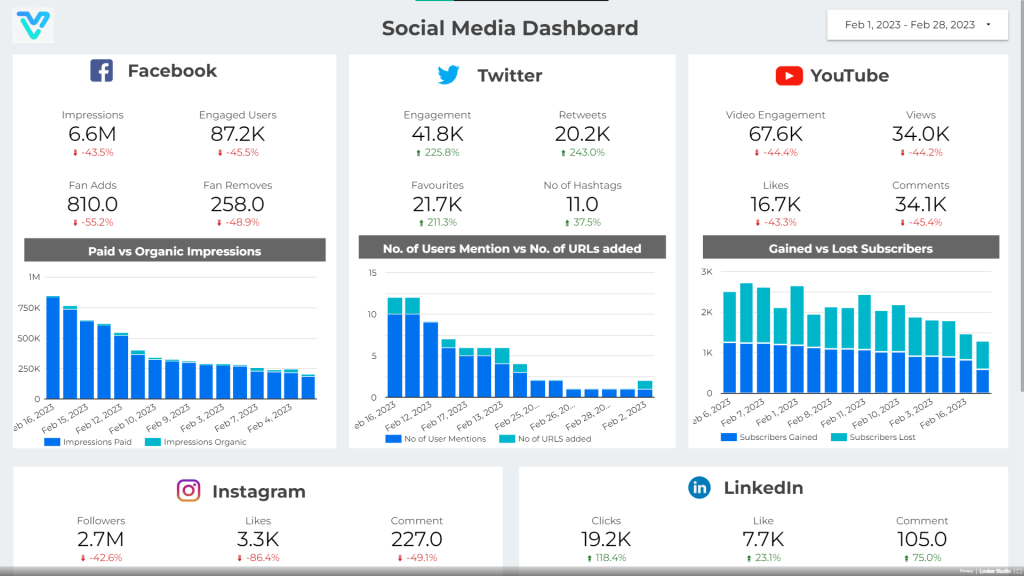
Combined Social Media Dashboard
Our Combined Social Media Dashboard aggregates data from all your social media platforms, providing insights into engagement, reach, and audience demographics. It helps you analyze the effectiveness of your social media campaigns, optimize content strategies, and improve brand presence. This dashboard is essential for maintaining a consistent and impactful social media presence.
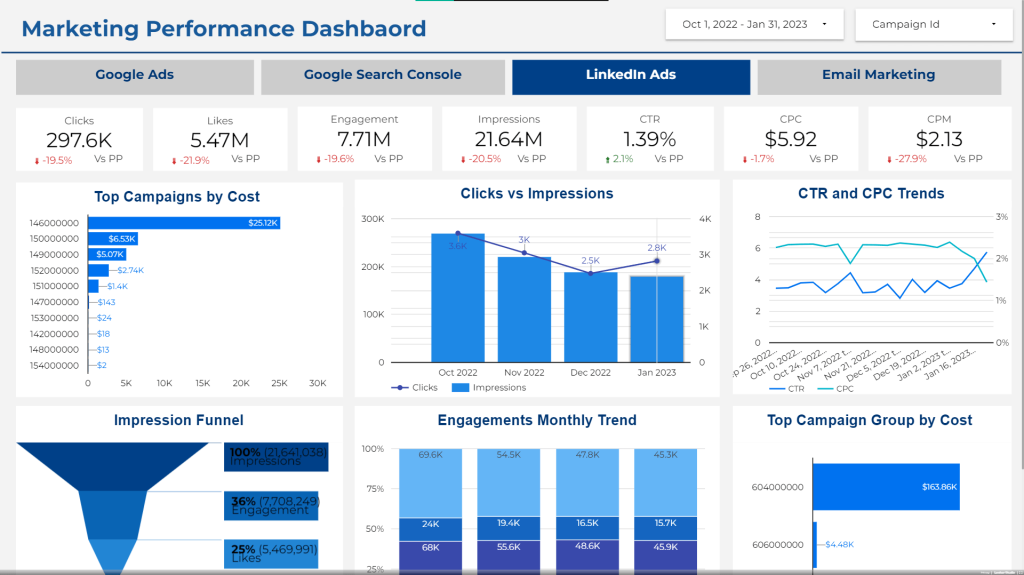
Combined Marketing Dashboard
The Combined Marketing Dashboard offers a holistic view of your marketing efforts across various channels, including email, social media, and paid ads. It provides insights into campaign performance, ROI, and customer engagement. This dashboard helps marketers align strategies, optimize budgets, and drive cohesive marketing initiatives for better results.
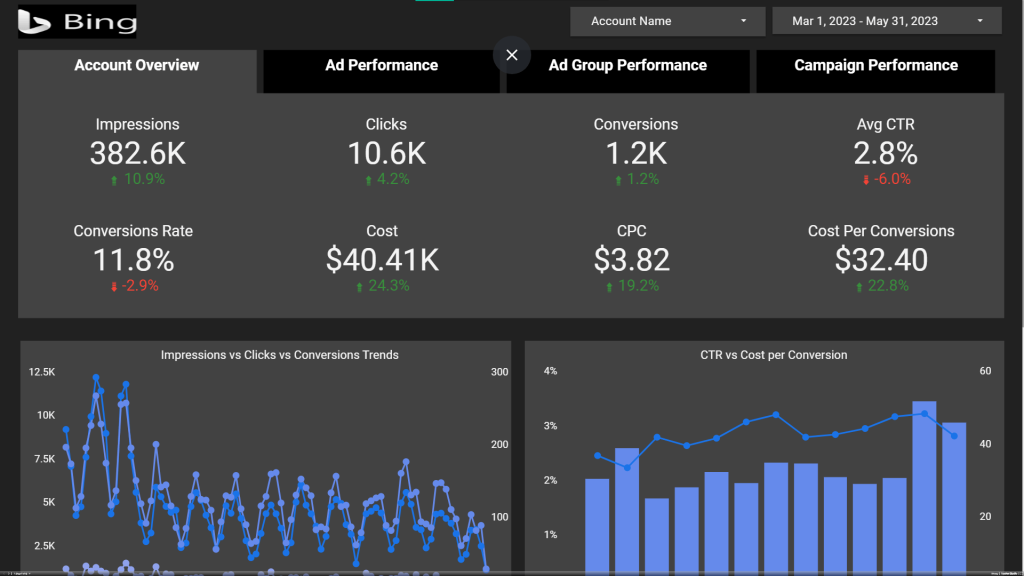
Bing Ads Performance Dashboard
Our Bing Ads Performance Dashboard delivers key metrics on your Bing advertising campaigns, such as impressions, clicks, and conversions. It helps you optimize your ad spend, track campaign effectiveness, and expand your reach beyond Google. This dashboard is ideal for businesses looking to diversify their advertising efforts and capture a broader audience.