Impression
Total number of times your content is displayed, indicating overall visibility.
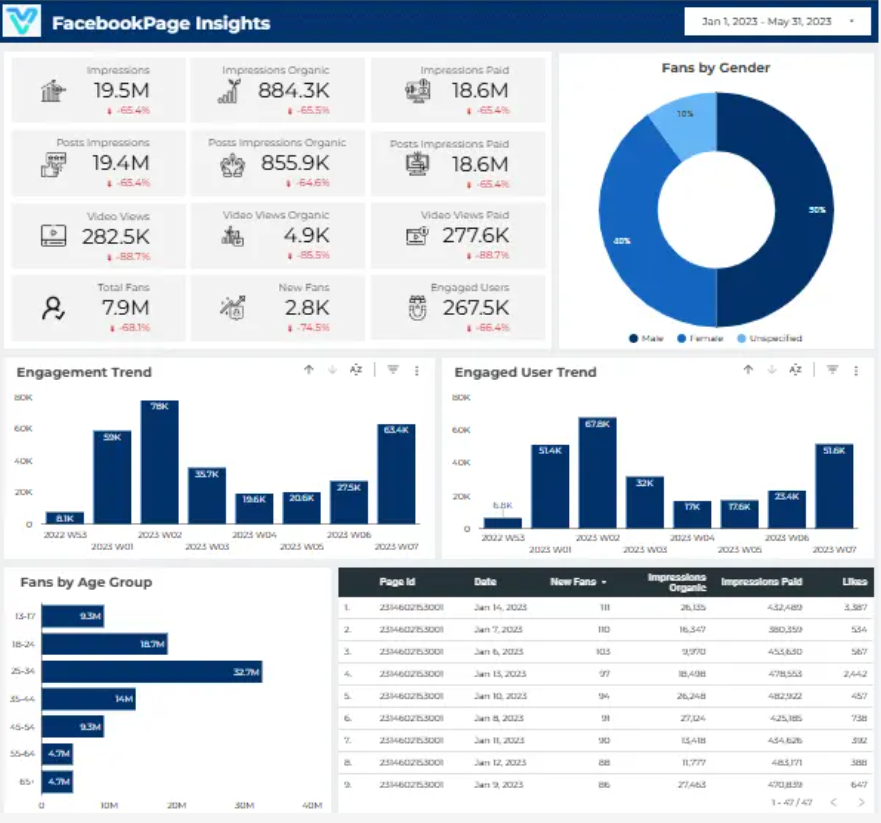
Tired of guessing what resonates with your audience on Facebook? Say goodbye to uncertainty with our Facebook Insight Dashboard. Dive into detailed follower insights to understand what content truly captivates your audience, empowering you to tailor your posts for maximum engagement and impact. Say hello to data-driven success!
Track reach, impressions, engagement, clicks, follower growth, and post performance in one Looker Studio Facebook insights view.
Built in Looker Studio with Facebook insights KPI tracking for reach, impressions, engagement, clicks, and follower growth.
Explore the core Looker Studio Facebook insights dashboard views built for social performance decisions.
Interactive Looker Studio Facebook insights reporting view.
Open the live embedded Looker Studio Facebook insight dashboard directly in a fullscreen modal.
Track reach, impressions, engagement, clicks, follower growth, and post performance in one Looker Studio view.
Total number of times your content is displayed, indicating overall visibility.
Total number of times your videos are watched, showing the level of video engagement.
Impressions from organic (non-paid) reach, reflecting the effectiveness of your organic content strategy.
The number of people who have liked your page, representing your audience size.
Impressions generated through paid advertising, demonstrating the impact of your paid campaigns.
Number of users who interacted with your content, indicating audience engagement.
Impressions specifically related to your posts, gauging the reach and engagement of individual posts.
Trend analysis of engaged users over time, helping identify patterns and adjust content strategy accordingly.
These are the practical Facebook reporting challenges this dashboard helps teams resolve.
Facebook Insights Dashboards provide easy access to key engagement metrics such as likes, comments, and shares. This helps businesses monitor how well their content resonates with their audience and adjust strategies accordingly
The dashboard displays how many people have seen a post (reach) and how many times it has been viewed (impressions). This data is crucial for evaluating the overall effectiveness of campaigns and understanding audience exposure.
Insights Dashboards show trends in audience growth over time, helping businesses track whether their social media strategy is resulting in more followers and higher engagement.
Facebook Insights Dashboards make it easier to create visually appealing reports for stakeholders. By consolidating key metrics in one place, businesses can communicate social media performance and ROI effectively.
By analyzing the CTR on links within posts, businesses can assess the effectiveness of calls to action (CTAs). This helps improve future posts and ensures better conversion from social media traffic.
With real-time data, businesses can immediately see how their content is performing and make quick adjustments if necessary. This agility is crucial for staying ahead in the fast-paced world of social media marketing.
Key Details
Key Facebook insights dashboard capabilities with context from the source page.
Total number of times your content is displayed, indicating overall visibility.
Total number of times your videos are watched, showing the level of video engagement.
Impressions from organic (non-paid) reach, reflecting the effectiveness of your organic content strategy.
The number of people who have liked your page, representing your audience size.
Impressions generated through paid advertising, demonstrating the impact of your paid campaigns.
Number of users who interacted with your content, indicating audience engagement.
Impressions specifically related to your posts, gauging the reach and engagement of individual posts.
Trend analysis of engaged users over time, helping identify patterns and adjust content strategy accordingly.
How this dashboard helps social teams move from fragmented Facebook insights reporting to faster content and engagement decisions.
Social teams often struggle with fragmented Facebook insights reporting, delayed engagement visibility, and low confidence in content performance trends.
This Looker Studio dashboard centralizes Facebook reach, impressions, engagement, clicks, and follower growth in one view for faster social decisions.
Find answers to common questions about this Looker Studio Facebook insight dashboard.
The Facebook Insights Dashboard is a tool that provides detailed analytics about the performance of your Facebook page and posts. It helps track engagement, audience demographics, and content performance
Experience superior data analysis with our custom dashboards. Specializing in all tools and technologies, we turn data into visually compelling, actionable insights
NDA-safeNo obligationClear next steps
This page was seeded from WordPress + Yoast data and mapped to your Sanity dashboard schema.