Clicks
Total number of times users click on your LinkedIn ads, indicating interest and potential for conversion.
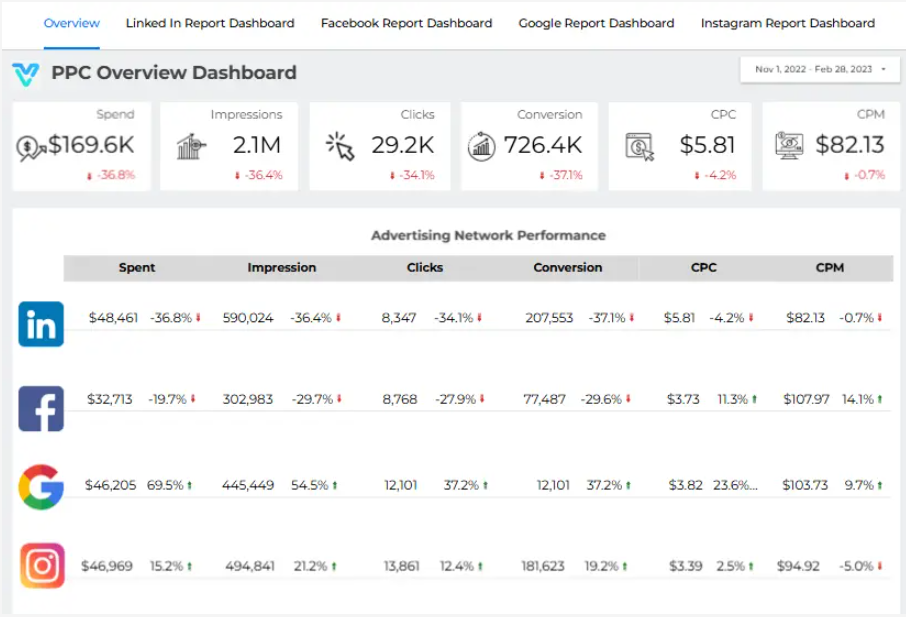
Unlock your PPC potential with the Combined PPC Dashboard! Monitor and optimize campaigns across Google Ads, Facebook Ads, and more—all in one place. Maximize ROI with unified insights and drive unprecedented results.
Track spend, clicks, conversions, ROAS, CPC, and platform performance across paid channels in one Looker dashboard.
Built in Looker with cross-platform PPC KPI tracking for spend, clicks, conversions, and ROAS.
Explore the core Looker combined PPC dashboard views built for cross-channel paid media decisions.
Interactive Looker combined PPC reporting view.
Open the live embedded Looker combined PPC dashboard directly in a fullscreen modal.
Track spend, clicks, conversions, ROAS, CPC, and channel performance in one Looker view.
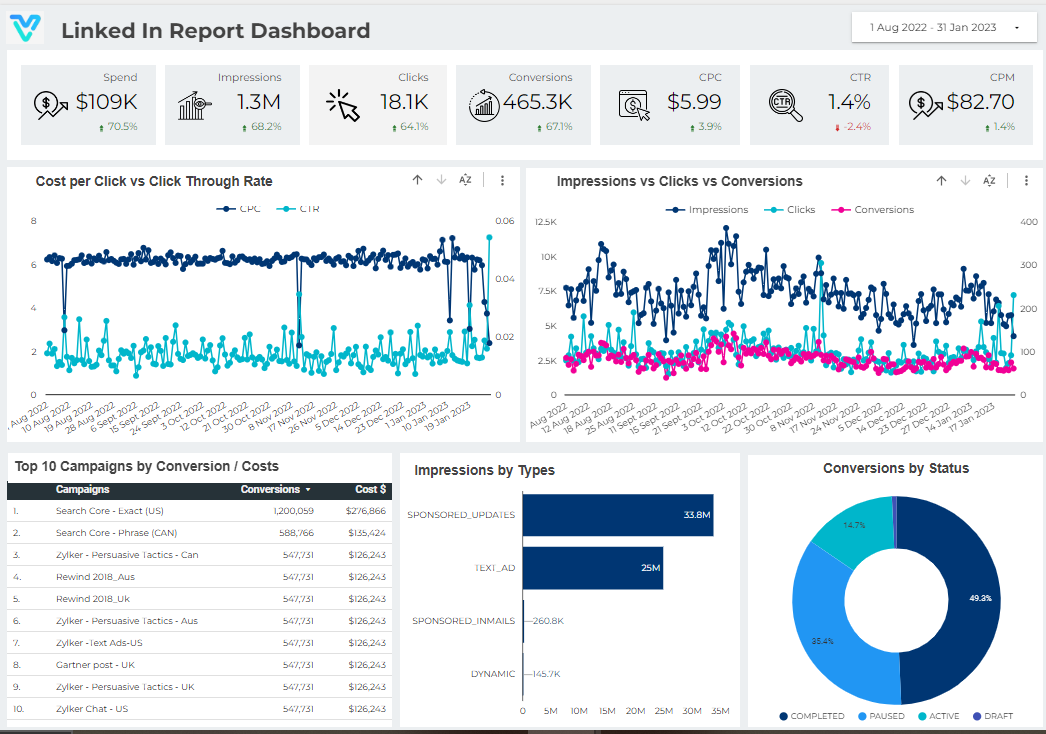
Total number of times users click on your LinkedIn ads, indicating interest and potential for conversion.
Average cost incurred for each click on your LinkedIn ads, indicating ad spend efficiency.
Total number of times your LinkedIn ads are displayed, reflecting the reach and visibility of your campaigns.
Cost of generating one thousand ad impressions, helping optimize budget allocation.
Percentage of ad clicks relative to impressions, measuring ad effectiveness in driving traffic.
Analysis of user interactions (likes, comments, shares) with your ads over time, providing insights into engagement patterns and campaign performance.
These are the practical PPC reporting challenges this dashboard helps teams resolve.
With a combined PPC dashboard, marketers can view all their campaign data from multiple platforms in one centralized location. This eliminates the need to switch between different accounts, saving time and effort.
Running separate reports for each platform can be time-consuming. A combined dashboard pulls all necessary data into one view, helping marketers save significant time spent compiling reports.
With access to real-time data from various platforms in one place, marketers can make faster, data-driven decisions without having to wait for individual platform reports.
With a Looker Studio dashboard, you can view and analyze data based on specific geographic locations. This enables you to tailor your marketing strategies based on region-specific needs and behaviors, enhancing local SEO efforts.
Visual representations such as charts and graphs make it easier for marketers to understand trends and performance metrics, improving the communication of results to clients or stakeholders.
By aggregating data such as cost-per-click, conversion rates, and overall ad spend, combined dashboards provide a clear view of ROI across all platforms, enabling better budget allocation.
Key Details
Key combined PPC dashboard capabilities with context from the source page.
Total number of times users click on your LinkedIn ads, indicating interest and potential for conversion.
Average cost incurred for each click on your LinkedIn ads, indicating ad spend efficiency.
Total number of times your LinkedIn ads are displayed, reflecting the reach and visibility of your campaigns.
Cost of generating one thousand ad impressions, helping optimize budget allocation.
Percentage of ad clicks relative to impressions, measuring ad effectiveness in driving traffic.
Analysis of user interactions (likes, comments, shares) with your ads over time, providing insights into engagement patterns and campaign performance.
How this dashboard helps paid-media teams move from fragmented platform reporting to faster PPC decisions.
Paid media teams often struggle with fragmented PPC reporting, delayed ROI visibility, and low confidence in cross-platform performance trends.
This Looker dashboard centralizes PPC spend, clicks, conversions, CPC, and ROAS across channels in one view for faster paid media decisions.
Find answers to common questions about this Looker combined PPC dashboard.
A combined PPC dashboard is a tool that consolidates data from multiple advertising platforms, such as Google Ads, Facebook, Instagram, LinkedIn, and others, into one unified interface for easier campaign management.
Experience superior data analysis with our custom dashboards. Specializing in all tools and technologies, we turn data into visually compelling, actionable insights
NDA-safeNo obligationClear next steps
This page was seeded from WordPress + Yoast data and mapped to your Sanity dashboard schema.