Days to Ship
$2.4M
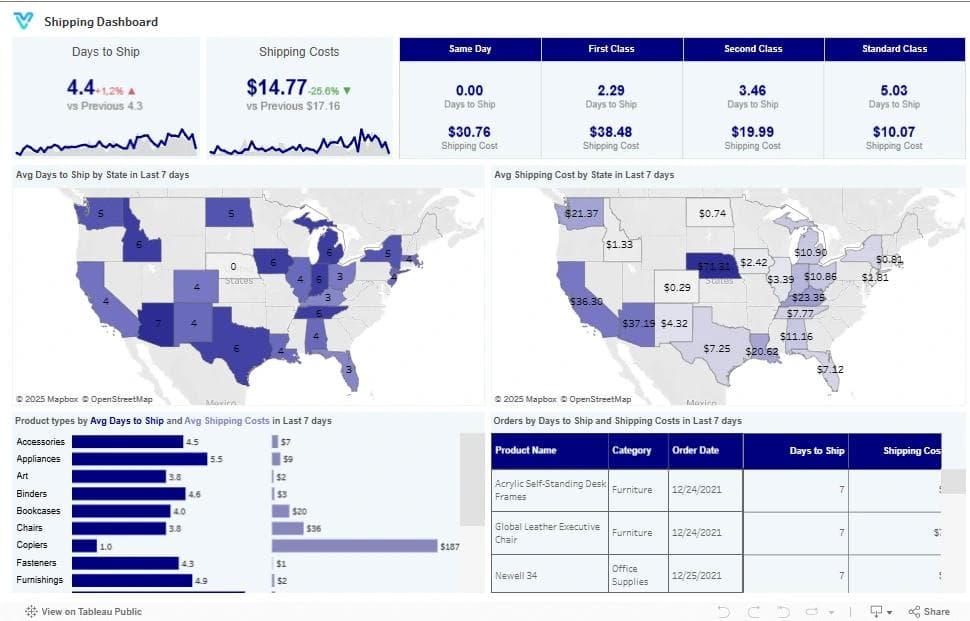
▲ The average number of days it takes for an order to be shipped from the moment it is placed to the time it is dispatched.
Unlock the power of seamless shipping with our Shipping Dashboard! Dive into a world of real-time insights, where every shipment, every detail counts. Track progress, identify delays, and optimize your delivery processes for faster, more efficient service and delighted customers.
Track shipment volume, delivery time, shipping cost, carrier performance, and on-time rates in one Tableau shipping view.
Built in Tableau with shipping KPI tracking for delivery time, cost, and carrier performance.
Trusted by teams across 15+ countries
Explore the core Tableau shipping dashboard views built for logistics and fulfillment decisions.
Interactive Tableau shipping reporting view.
Open the live embedded Tableau shipping dashboard directly in a fullscreen modal.
Track shipment volume, delivery time, shipping cost, on-time rates, and carrier performance in one decision-ready view.
$2.4M
▲ The average number of days it takes for an order to be shipped from the moment it is placed to the time it is dispatched.
18%
▲ It typically results in higher costs compared to other shipping methods due to the need for expedited processing and fast delivery.
$740K
▲ It is typically the most economical option, with slower delivery times compared to Same Day, First Class, and Second Class.
$1.2M
▲ This metric helps businesses track how much they are spending on logistics, identify cost-effective shipping options, and assess the profitability of their shipping strategy.
99.2%
▲ By tracking shipping costs for First Class and Second-Class options, businesses can assess the trade-off between shipping speed and cost.
These are the practical shipping visibility challenges this dashboard helps teams resolve.
When shipping KPIs are scattered across systems, teams struggle to understand delivery trends quickly.
A centralized dashboard helps teams spot late shipments and service issues earlier.
Shipping cost, carrier performance, and accessorial charges are easier to optimize with one view.
Teams need consistent KPIs to compare carrier performance and regional delivery trends.
Automated shipping dashboards reduce spreadsheet reporting and speed up operational reviews.
A single Tableau dashboard keeps delivery time, cost, and on-time KPIs consistent across teams.
Key Details
Key shipping dashboard capabilities with context from the source page.
The average number of days it takes for an order to be shipped from the moment it is placed to the time it is dispatched.
It typically results in higher costs compared to other shipping methods due to the need for expedited processing and fast delivery.
It is typically the most economical option, with slower delivery times compared to Same Day, First Class, and Second Class.
This metric helps businesses track how much they are spending on logistics, identify cost-effective shipping options, and assess the profitability of their shipping strategy.
By tracking shipping costs for First Class and Second-Class options, businesses can assess the trade-off between shipping speed and cost.
How this dashboard helps logistics teams move from fragmented shipping reporting to faster delivery decisions.
Logistics teams often struggle with fragmented shipping reporting, delayed visibility into delivery performance, and low confidence in carrier efficiency trends.
This Tableau dashboard centralizes shipment volume, delivery time, shipping cost, and carrier performance KPIs in one view for faster logistics decisions. Want a Tableau dashboard like this for your team? See our Tableau consulting service.
Find answers to common questions about this Tableau shipping dashboard.
“Days to Ship” refers to the average time taken from when an order is placed to when it is dispatched. This metric assesses the efficiency of your order fulfillment process and reflects how quickly your team can prepare and send out orders. Lowering this time can significantly enhance customer satisfaction.
From Lets Viz
Experience superior data analysis with our custom dashboards. Specializing in all tools and technologies, we turn data into visually compelling, actionable insights
NDA-safe · No obligation · Clear next steps