Sales Growth Rate
14.2%
▲ Measures the percentage change in sales over a specific period, indicating whether the business is expanding or contracting.
Unlock the power of seamless sales management with our Sales Executive Dashboard! Dive into a world of real-time insights, where every deal, every detail matters. Track progress, monitor pipelines, and optimize your sales strategies for better performance, higher revenue, and empowered sales teams.
Track revenue, profit, pipeline, customer trends, and performance KPIs in one executive-ready Tableau view.
Built in Tableau for sales leaders with executive KPI tracking and drill-down visibility.
Trusted by teams across 15+ countries
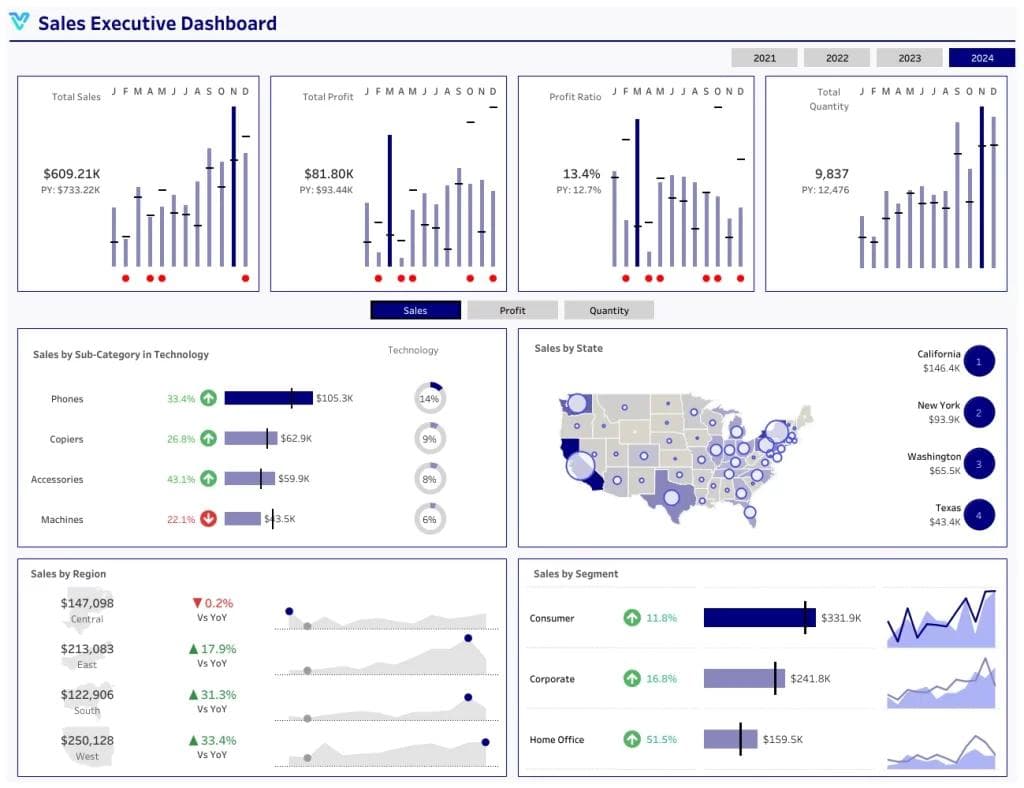
Explore the core Tableau sales executive dashboard views built for leadership decisions.
Interactive Tableau sales executive reporting view.
Open the live embedded finance dashboard directly in a fullscreen modal.
Track revenue, profit, sales trends, and executive KPIs in one decision-ready view.
14.2%
▲ Measures the percentage change in sales over a specific period, indicating whether the business is expanding or contracting.
18%
▲ The proportion of successfully closed deals compared to total opportunities, showcasing the effectiveness of the sales team.
$3.8K
▲ Estimates the total income a customer will bring during their association with the business, aiding in retention and upselling strategies.
24%
▲ Represents the typical revenue earned from a single closed deal, helping to assess the potential value of sales opportunities.
18%
▲ The percentage of revenue that turns into profit. It helps benchmark against industry standards and highlights areas where margins can be improved.
$2.4M
▲ Tracks the extra revenue gained from upselling or cross-selling, identifying opportunities to boost customer value.
These are the practical sales challenges this dashboard helps teams resolve.
When KPIs are spread across tools, leaders struggle to get a trusted single view of performance.
Delayed reporting makes it harder to respond quickly to shifts in revenue, margin, and pipeline health.
A unified dashboard helps standardize reporting logic so performance reviews stay aligned across teams.
Key Details
Key Tableau sales executive dashboard capabilities with context from the source page.
How this dashboard helps sales leaders move from fragmented reporting to faster, more confident decisions.
Finance teams often struggle with delayed reporting, fragmented sources, and low confidence in KPI consistency.
This dashboard centralizes financial metrics in one view with real-time updates and consistent definitions. Want a Tableau dashboard like this for your team? See our Tableau consulting service.
Find answers to common questions about this finance dashboard.
A Sales Executive Dashboard is designed to provide high-level, actionable insights into sales operations and performance. The key metrics typically displayed on such a dashboard include: 1. Revenue Metrics: Total Sales Revenue, Revenue by Product/Service, Revenue by Region, Recurring Revenue (if applicable) 2. Sales Performance Metrics: Sales Growth Rate, Sales Target Achievement, Top-Performing Sales Reps, Win Rate 3. Pipeline Metrics: Sales Pipeline Value, Pipeline Stage Distribution, Deal Size, Lead-to-Deal Conversion Rate 4. Customer Metrics: Customer Acquisition Cost (CAC), Customer Lifetime Value (CLV), Retention Rate, Churn Rate 5. Financial Metrics: Profit Margin, Discount Rate Utilization, Sales Expense vs. Revenue By customizing these metrics to your organization’s specific goals, the Sales Executive Dashboard can become a powerful tool for data-driven decision-making and strategic planning.
From Lets Viz
Experience superior data analysis with our custom dashboards. Specializing in all tools and technologies, we turn data into visually compelling, actionable insights
NDA-safe · No obligation · Clear next steps