Average Order Value
$2.4M
▲ The average number of days it takes for an order to be shipped from the moment it is placed to the time it is dispatched.
Unlock the power of seamless order management with our Orders Dashboard! Dive into a world of real-time insights, where every order, and every detail matters. Track statuses, manage fulfillment, and optimize your processes for faster, more efficient service and satisfied customers.
Track order volume, fulfillment time, returns, revenue, and customer order trends in one Tableau orders view.
Built in Tableau with order KPI tracking for volume, fulfillment time, returns, and revenue.
Trusted by teams across 15+ countries
Explore the core Tableau orders dashboard views built for order and fulfillment decisions.
Interactive Tableau orders reporting view.
Open the live embedded Tableau orders dashboard directly in a fullscreen modal.
Track order volume, fulfillment time, returns, revenue, and order trends in one decision-ready view.
$2.4M
▲ The average number of days it takes for an order to be shipped from the moment it is placed to the time it is dispatched.
18%
▲ Tracking unfulfilled orders helps identify operational bottlenecks and areas where supply chain or inventory management can be improved.
$740K
▲ The average time it takes for suppliers to deliver products after an order is placed. This KPI helps evaluate the efficiency of your suppliers and highlights potential delays in the supply chain that could affect order fulfillment.
24%
▲ This KPI helps assess the efficiency of the fulfillment process, including shipping and logistics, and is critical for customer satisfaction and retention.
99.2%
▲ This metric indicates how reliably your business fulfills orders within the expected delivery window. A high on-time delivery rate is crucial for customer satisfaction and loyalty.
2.1x
▲ The percentage of orders that contain faulty or damaged items. This KPI is essential for assessing product quality and customer satisfaction.
These are the practical order visibility challenges this dashboard helps teams resolve.
When order KPIs are scattered across systems, teams struggle to understand volume trends quickly.
A centralized dashboard helps teams spot delays in fulfillment and delivery earlier.
Returns and refunds are easier to monitor when tracked alongside order volume and revenue.
Teams need a unified view of revenue and order value trends to make better inventory and marketing decisions.
Automated order dashboards reduce spreadsheet reporting and speed up operational reviews.
A single Tableau dashboard keeps order volume, fulfillment time, and revenue KPIs consistent across teams.
Key Details
Key orders dashboard capabilities with context from the source page.
The average number of days it takes for an order to be shipped from the moment it is placed to the time it is dispatched.
Tracking unfulfilled orders helps identify operational bottlenecks and areas where supply chain or inventory management can be improved.
The average time it takes for suppliers to deliver products after an order is placed. This KPI helps evaluate the efficiency of your suppliers and highlights potential delays in the supply chain that could affect order fulfillment.
This KPI helps assess the efficiency of the fulfillment process, including shipping and logistics, and is critical for customer satisfaction and retention.
This metric indicates how reliably your business fulfills orders within the expected delivery window. A high on-time delivery rate is crucial for customer satisfaction and loyalty.
The percentage of orders that contain faulty or damaged items. This KPI is essential for assessing product quality and customer satisfaction.
How this dashboard helps operations teams move from fragmented order reporting to faster fulfillment decisions.
Operations teams often struggle with fragmented order reporting, delayed visibility into fulfillment performance, and low confidence in order trend analysis.
This Tableau dashboard centralizes order volume, fulfillment time, returns, and revenue KPIs in one view for faster order decisions. Want a Tableau dashboard like this for your team? See our Tableau consulting service.
Find answers to common questions about this Tableau orders dashboard.
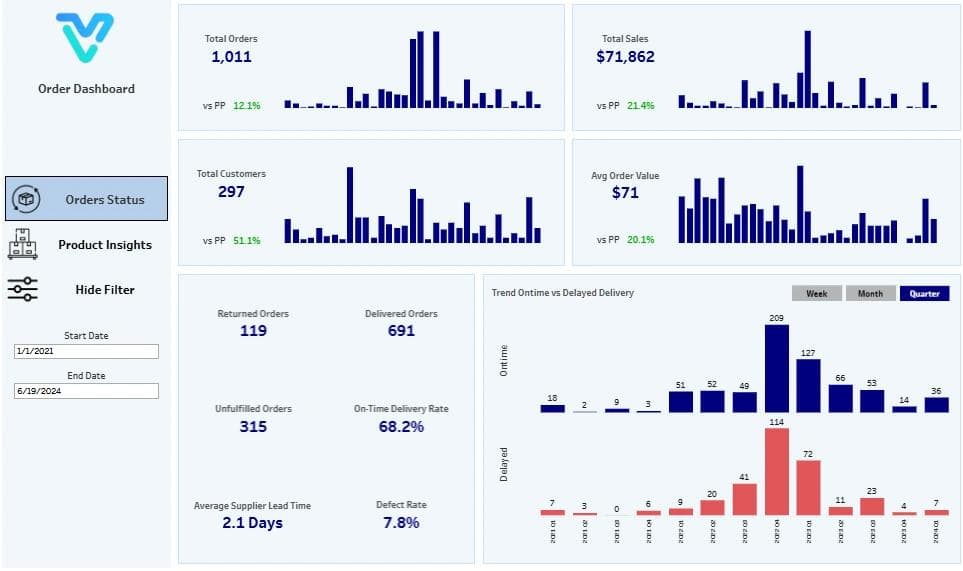
The Order Dashboard tracks several important metrics, including: Total Orders: The total number of orders placed within a specified time frame. Total Sales: The total revenue generated from all orders. Delivered Orders: The number of orders successfully delivered to customers. Returned Orders: The number of orders returned by customers. Unfulfilled Orders: Orders that have not been completed or shipped. On-Time Delivery Rate: The percentage of orders delivered within the expected timeframe. Average Order Value (AOV): The average amount spent per order. Average Supplier Lead Time: The average time taken by suppliers to deliver products. Defect Rate: The percentage of orders that contain faulty or damaged items. These metrics provide valuable insights into order performance and operational efficiency.
From Lets Viz
Experience superior data analysis with our custom dashboards. Specializing in all tools and technologies, we turn data into visually compelling, actionable insights
NDA-safe · No obligation · Clear next steps