Order Fill Rate
98.4%
Percentage of order lines fulfilled completely from available stock on first pick attempt
▲ Target: 99% — closing in
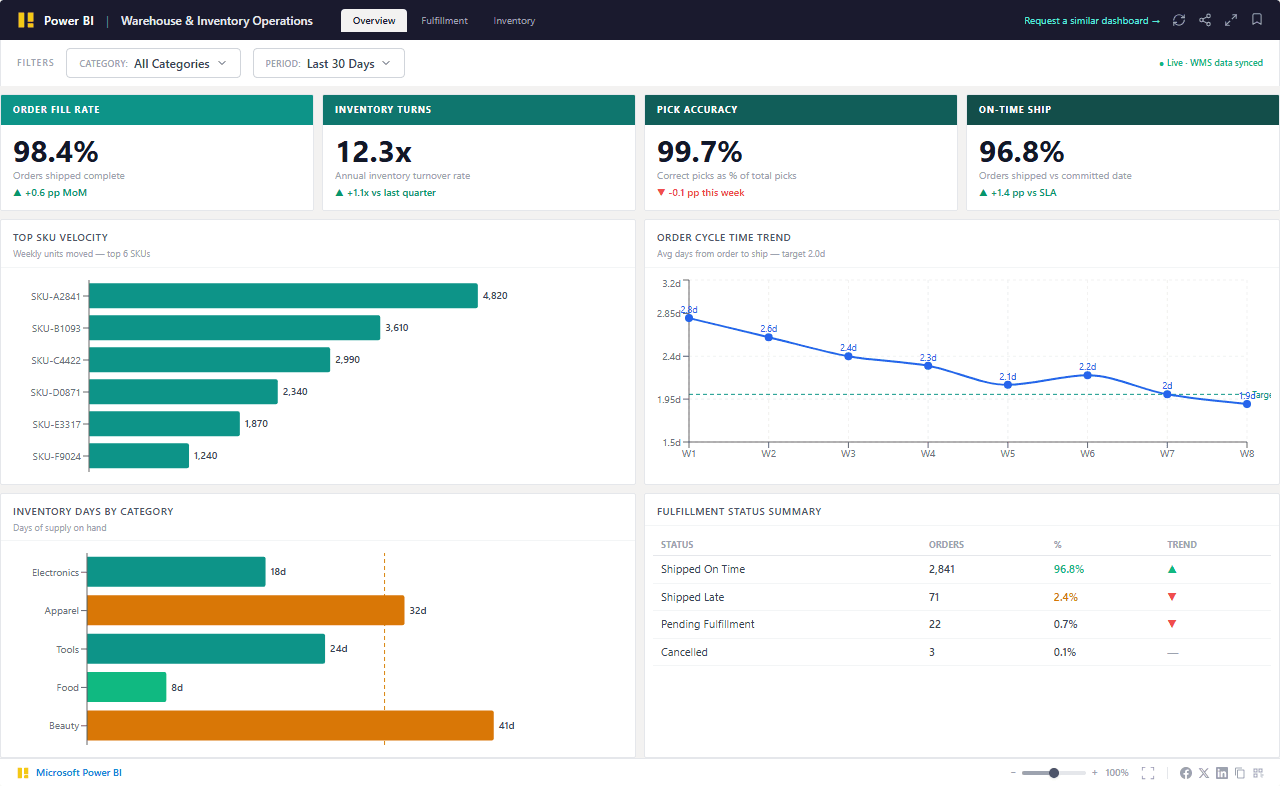
Order Fill Rate, Pick Accuracy, and Inventory Turns across every category and zone — SKU velocity, order cycle time, and days-on-hand in one view. Built for warehouse managers and supply chain directors who need fulfillment visibility without pulling five WMS reports.
Powered by modern analytics tools including
Power BI, Tableau, Zoho and Looker.
Trusted by teams across 15+ countries
Real impact, clearly measured. These KPIs show the tangible outcomes of data-informed strategy.
98.4%
Percentage of order lines fulfilled completely from available stock on first pick attempt
▲ Target: 99% — closing in
12.3×
Annual inventory turns — higher indicates efficient stock utilization and lower carrying cost
▲ Industry avg: 8×
99.7%
Percentage of order picks completed without errors — directly tied to return rate and customer satisfaction
▲ < 0.3% error rate
96.8%
Percentage of orders shipped on or before the promised ship date
▼ -0.4 pp — carrier delay spike
How we turned fragmented data into a single source of truth—and what we achieved.
Charlotte's distribution centers — serving major retail, e-commerce, and industrial customers through the I-85 corridor — track Order Fill Rate and On-Time Shipment from daily WMS email exports that arrive at 7 AM and are already 12 hours old. Pick accuracy is calculated monthly by counting exception reports. Inventory turns are estimated from the ERP inventory valuation report that finance runs quarterly. When a high-velocity SKU stockouts, the warehouse manager finds out when the order fails — not 48 hours before when a reorder trigger would have prevented it.
We connect your WMS (Manhattan Associates, Blue Yonder, SAP EWM, or NetSuite WMS) and ERP inventory module to a Power BI dashboard that refreshes every 30 minutes. Warehouse managers see Order Fill Rate and Pick Accuracy by zone in near-real-time. Supply chain directors see Inventory Turns and days-on-hand by category without waiting for a finance report. SKU velocity ranking surfaces the top movers and flags slow-moving stock before it becomes obsolete.
Find answers to common questions about this dashboard and our process.
We support Manhattan Associates SCALE and Manhattan Active WMS (via REST API or SQL reporting database), Blue Yonder WMS (SQL or API), SAP Extended Warehouse Management (via SAP BW or direct SQL), NetSuite WMS (REST API), and Fishbowl (ODBC). For operations using 3PL WMS platforms (3PL Central, Deposco), we connect via the platform's REST API or webhook feed. Integration method and refresh frequency are confirmed in the scoping call based on your system's API capabilities and IT security configuration.
From Lets Viz
Let's build something extraordinary together. Book a free consultation with our experts today.