Featured Dashboard

Utility Operations & SCADA Analytics Dashboard

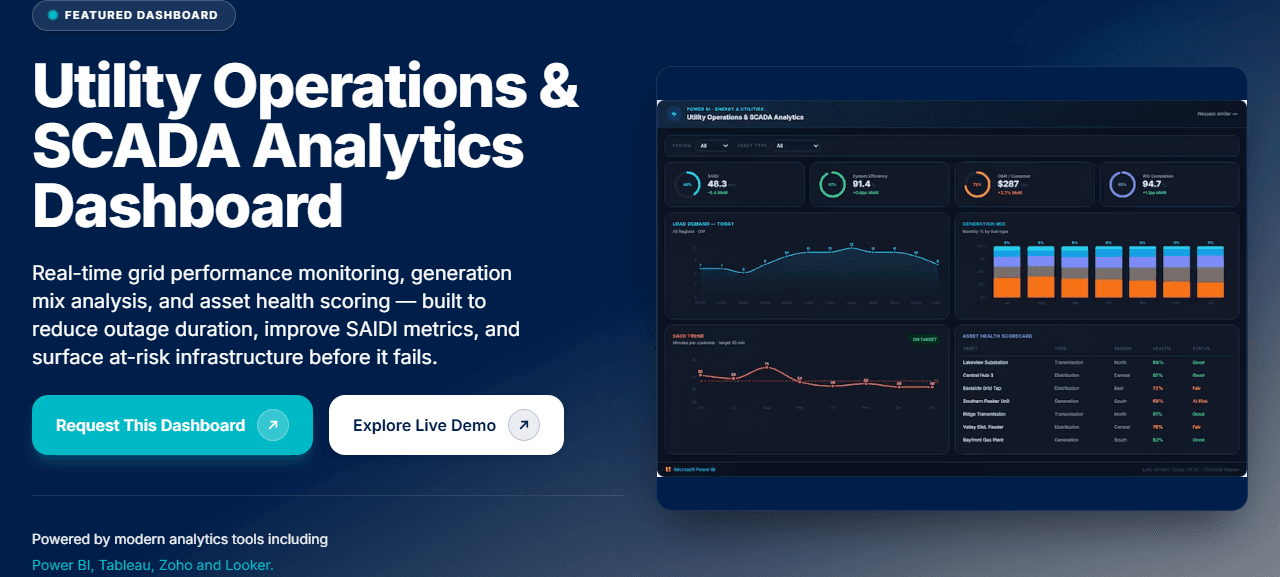
Real-time grid performance monitoring, generation mix analysis, and asset health scoring — built to reduce outage duration, improve SAIDI metrics, and surface at-risk infrastructure before it fails.

Powered by modern analytics tools including

Power BI, Tableau, Zoho and Looker.

Utility Operations & SCADA Analytics Dashboard — interactive Power BI dashboard preview

Trusted by teams across 15+ countries

100+
Clients Served
300+
Dashboards Delivered
50,000+
Hours Saved
5.0★
Rating · 15 Reviews
Trusted by teams at
Audience

Who This Dashboard Is For

Ideal For

  • Electric and gas utilities with SCADA infrastructure and OMS systems generating operational data daily
  • Grid operations and reliability engineering teams responsible for SAIDI, MAIFI, and regulatory compliance metrics
  • Charlotte-area utilities and energy companies operating in the Duke Energy territory or serving the Piedmont region
  • Utility operations managers who need a single view of load, generation, asset health, and work order performance
  • Regulatory affairs teams that need automated SAIDI/MAIFI reporting for state PUC or FERC submissions

Not Ideal For

  • Organizations without SCADA or digital OMS systems — the dashboard requires structured operational data
  • Utilities that only need billing or customer satisfaction analytics — this dashboard is focused on grid and asset performance
  • Teams looking for demand forecasting models — this dashboard reports actuals and near-term trends, not long-range load forecasts
By the numbers

Metrics That Drive Decisions

Real impact, clearly measured. These KPIs show the tangible outcomes of data-informed strategy.

SAIDI (min/customer)

48.3

System Average Interruption Duration Index — cumulative outage minutes per customer

Below 55 min target

System Efficiency

91.4%

Overall grid generation and transmission efficiency across all assets

+0.6pp vs prior month

O&M Cost/Customer

$287

Monthly operations and maintenance cost per customer on the grid

+3.2% YoY (inflation)

Work Order Completion

94.7%

Percentage of planned maintenance work orders completed on schedule

+1.1pp vs Q4 average

From challenge to success

From Reactive Grid Management to Predictive Reliability

How we turned fragmented data into a single source of truth—and what we achieved.

The challenge

Most utility operations teams are managing the grid reactively — monitoring outages after they happen, running work orders based on fixed schedules rather than actual asset condition, and producing SAIDI reports in spreadsheets the day after the event. SCADA historians capture terabytes of operational data daily, but turning that data into actionable reliability intelligence requires engineering hours that operations teams don't have.

  • SCADA historians generate data continuously but most of it lives in operational silos, inaccessible to management reporting
  • SAIDI calculations require integrating OMS outage records with customer count data — typically a manual monthly process
  • Asset health is assessed on fixed inspection cycles, not on actual condition signals from real-time sensor data
  • Generation mix reporting requires aggregating data from multiple generation assets and fuel types into a single source

Our approach

We built a Power BI semantic model on top of your SCADA historian, OMS, and EAM data that monitors load demand, generation mix, SAIDI, and asset health in a single dashboard — refreshed every hour. The model surfaces at-risk assets before they cause outages and tracks reliability trends against your regulatory targets.

  • Connect to SCADA historian (OSIsoft PI or GE Proficy) via Power BI connector or REST API for real-time load and generation data
  • Integrate OMS interruption records with customer count data to calculate live SAIDI and MAIFI metrics
  • Score asset health using a composite model: inspection history, age, load utilization, and fault history from EAM
  • Automate generation mix aggregation across fuel types with daily refresh to track renewable penetration targets

What we achieved

SAIDI improved from 62 minutes to 48.3 minutes per customer over two quarters
At-risk asset identification reduced emergency repair response time by 40% through proactive scheduling
Operations team replaced 3 hours of weekly manual reporting with automated dashboard review
Renewable penetration tracking enabled accurate quarterly regulatory reporting without manual data assembly
Work order backlog visibility led to 6pp improvement in on-schedule completion rate
Results verifiedRead full case study

Frequently Asked Questions

Find answers to common questions about this dashboard and our process.

We support OSIsoft PI (now AVEVA PI System) via the PI Web API connector, GE Proficy Historian via OLEDB, Ignition via REST API, and Wonderware InTouch via ODBC. For utilities without a PI historian, we can work from structured CSV or parquet exports to Azure Blob Storage or SharePoint. The exact integration method is confirmed during the scoping call and depends on your network security and historian version.

From Lets Viz

Ready to Transform Your Data?

Let's build something extraordinary together. Book a free consultation with our experts today.