Featured Dashboard

Supply Chain Risk & Supplier Scorecard

Real-time supplier performance monitoring, risk tiering, and procurement savings tracking — built to reduce lead time variance and protect your margins before disruptions escalate.

Powered by modern analytics tools including

Power BI, Tableau, Zoho and Looker.

Supply Chain Risk & Supplier Scorecard — interactive Power BI dashboard preview

Trusted by teams across 15+ countries

100+
Clients Served
300+
Dashboards Delivered
50,000+
Hours Saved
5.0★
Rating · 15 Reviews
Trusted by teams at
Audience

Who This Dashboard Is For

Ideal For

  • Manufacturing, distribution, and retail operations with 20+ active suppliers across multiple spend categories
  • Procurement and supply chain teams using SAP S/4HANA, Oracle NetSuite, or Microsoft Dynamics 365
  • Atlanta-based logistics hubs, distribution centers, and regional manufacturing operations serving the Southeast
  • Organizations managing global supplier networks where on-time and lead time variance directly impacts customer SLAs
  • Operations managers who need a weekly supplier review meeting dashboard that updates automatically

Not Ideal For

  • Businesses with fewer than 10 active suppliers where a simple spreadsheet is sufficient
  • Organizations without digital purchase order data — the dashboard requires ERP transaction records
  • Teams that need real-time inventory count tracking — this dashboard tracks lead time and delivery performance, not warehouse stock levels
By the numbers

Metrics That Drive Decisions

Real impact, clearly measured. These KPIs show the tangible outcomes of data-informed strategy.

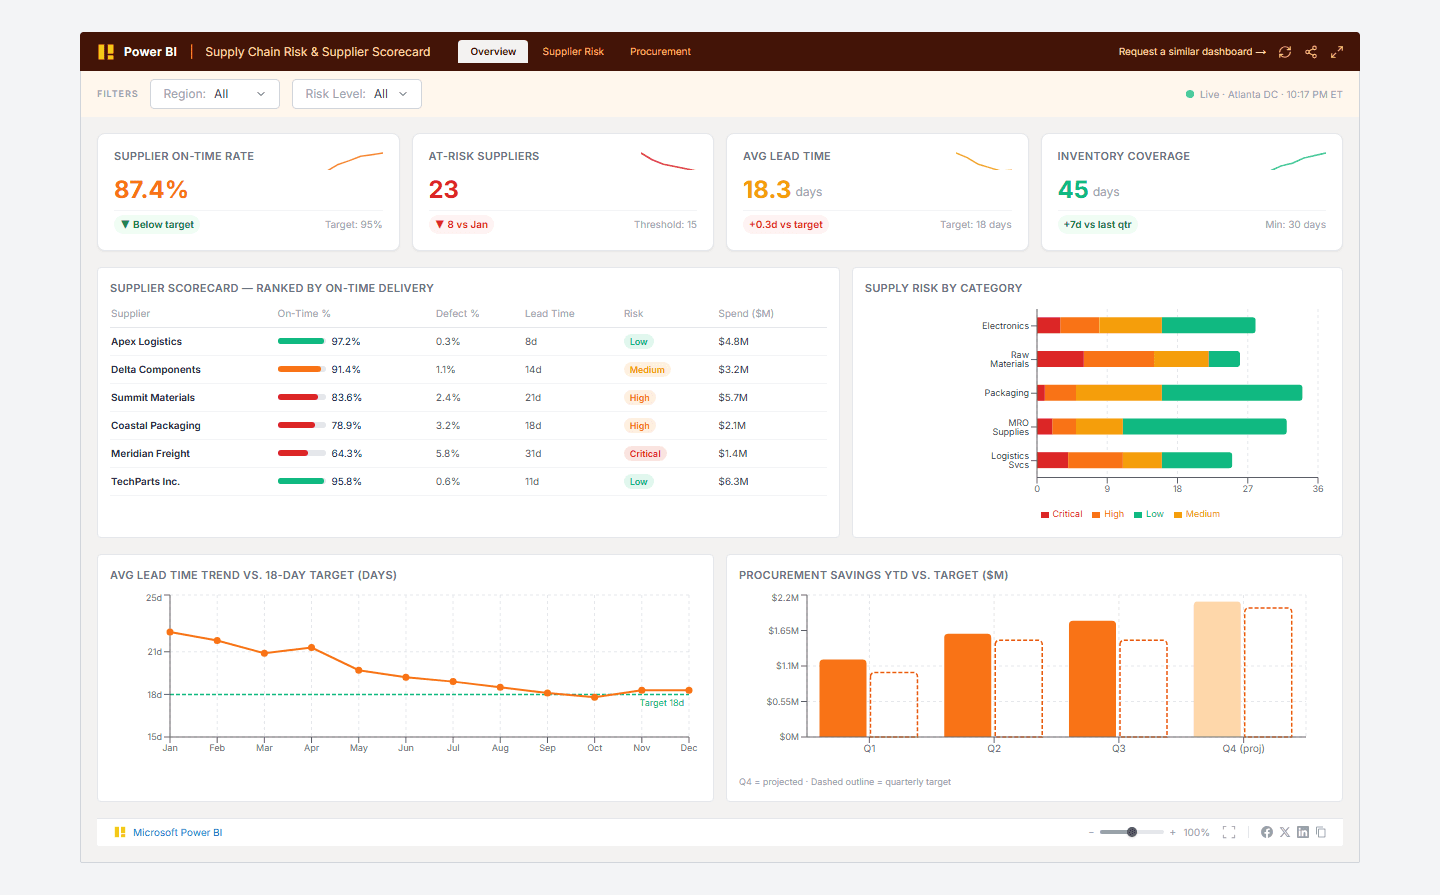
Supplier On-Time Rate

87.4%

Percentage of supplier deliveries arriving on the committed date

Up from 84% — Jan baseline

At-Risk Suppliers

23

Suppliers rated High or Critical risk in current scoring period

Down 8 from January peak

Avg Lead Time

18.3 d

Average days from purchase order to confirmed delivery across all suppliers

Down from 22.4d in January

Inventory Coverage

45 d

Days of forward inventory coverage based on current consumption rates

+7 days vs last quarter

From challenge to success

From Reactive Fire-Fighting to Proactive Risk Monitoring

How we turned fragmented data into a single source of truth—and what we achieved.

The challenge

Most operations teams find out about supplier failures after they happen — a shipment is late, a line goes down, or a customer escalates. By that point, the cost to expedite, re-source, or hold production has already been incurred. ERP systems have the data, but pulling meaningful supplier scorecards requires weeks of manual work that nobody has time for.

  • ERP systems capture PO data but don't produce cross-supplier risk scores or ranked scorecards automatically
  • Procurement teams spend 3-5 hours/week pulling data manually instead of acting on it
  • Lead time variance is invisible until it causes a stockout — there is no early warning system
  • Category risk is assessed once a year in a spreadsheet, not monitored in real time

Our approach

We built a Power BI semantic model on top of your ERP transaction data (SAP, Oracle NetSuite, or Dynamics 365) that scores every active supplier on delivery, quality, lead time, and spend exposure — refreshed daily. The dashboard surfaces at-risk suppliers before they create disruption, and tracks procurement savings against quarterly targets.

  • Connect to ERP purchase order, receipt, and quality inspection tables via direct query or daily export
  • Build a composite supplier risk score (on-time weight 40%, defect rate 30%, lead time variance 20%, spend concentration 10%)
  • Tier suppliers into Critical / High / Medium / Low with configurable threshold rules
  • Procurement savings tracked against negotiated baseline prices per category and supplier

What we achieved

Reduced time to identify at-risk suppliers from 3 weeks to same-day
On-time delivery rate improved from 84% to 87.4% within 2 quarters of go-live
Average lead time reduced from 22.4 days to 18.3 days across all categories
Procurement team savings tracking moved from quarterly spreadsheets to real-time visibility
3 critical-tier suppliers were re-sourced proactively before causing production disruptions
Results verifiedRead full case study

Frequently Asked Questions

Find answers to common questions about this dashboard and our process.

We support SAP S/4HANA and ECC (via ODBC or OData), Oracle NetSuite (REST API or SuiteAnalytics Connect), Microsoft Dynamics 365 Supply Chain Management (Dataverse), and Epicor. For systems without a direct connector, we can work from daily CSV/Excel exports staged in SharePoint or Azure Blob Storage. The exact integration method is confirmed in the scoping call.

From Lets Viz

Ready to Transform Your Data?

Let's build something extraordinary together. Book a free consultation with our experts today.