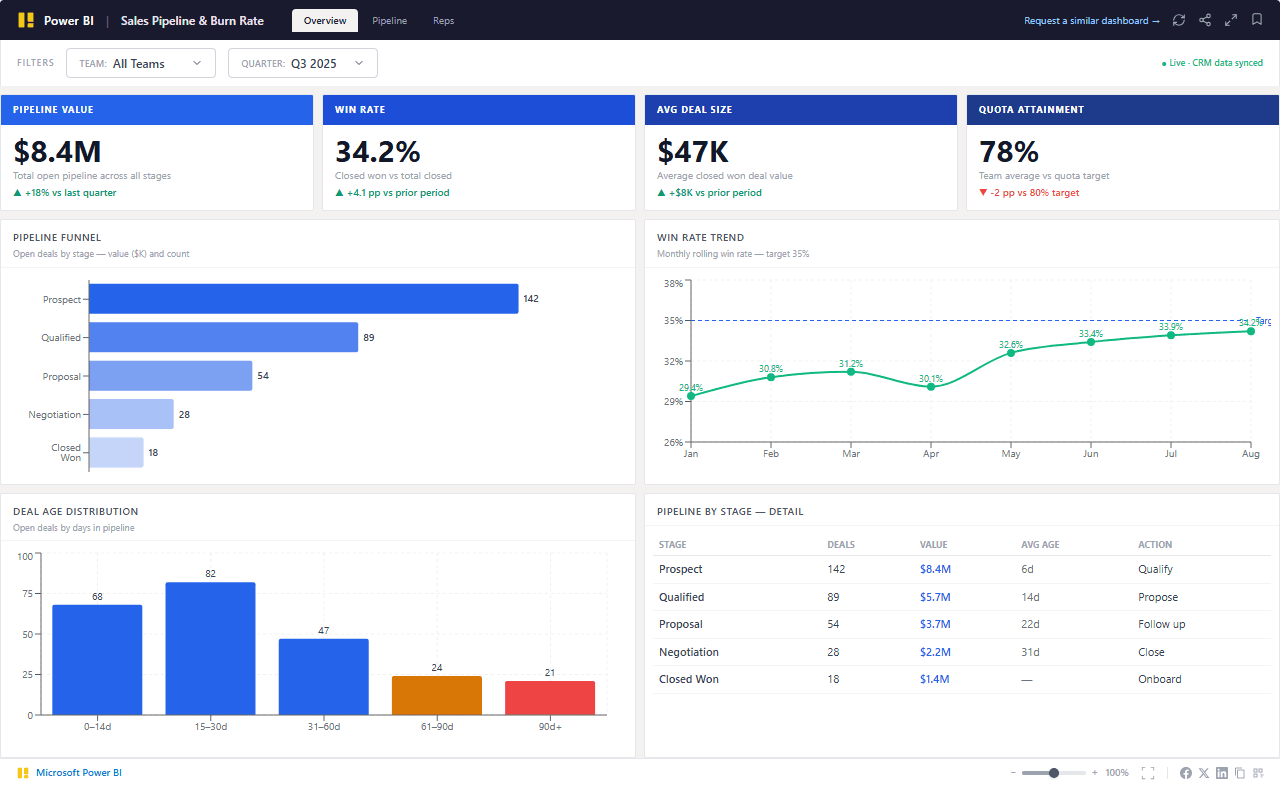
Featured Dashboard

Sales Pipeline & Revenue Operations Dashboard

Pipeline value, Win Rate, and quota attainment by rep — funnel stage conversion, deal age distribution, and stage velocity in one view. Built for RevOps and sales managers who need pipeline clarity without exporting five Salesforce reports every Monday morning.

Powered by modern analytics tools including

Power BI, Tableau, Zoho and Looker.

Sales Pipeline & Revenue Operations Dashboard — interactive Power BI dashboard preview

Trusted by teams across 15+ countries

100+
Clients Served
300+
Dashboards Delivered
50,000+
Hours Saved
5.0★
Rating · 15 Reviews
Trusted by teams at
Audience

Who This Dashboard Is For

Ideal For

  • Charlotte-area B2B sales organizations — financial services firms (Bank of America, Truist, LPL Financial), SaaS companies, commercial real estate operators, and professional services firms with 5-50 person sales teams
  • RevOps managers, VP Sales, and sales operations analysts who currently spend 30+ minutes each week assembling pipeline reports from Salesforce exports
  • Sales managers running weekly pipeline reviews who want one consistent view of stage conversion, deal age, and rep attainment instead of five separate reports
  • Companies using Salesforce, HubSpot, or Microsoft Dynamics 365 as their CRM — these are the data sources the dashboard connects to
  • Teams tracking quota attainment manually in a spreadsheet or in a CRM report that requires weekly manual updates

Not Ideal For

  • Solopreneur or very early-stage teams (fewer than 3 reps) where the overhead of a structured pipeline view doesn't match the data volume yet
  • Organizations without a CRM — pipeline dashboards require structured opportunity data with stage, value, and close date fields in a system of record
  • Pure inbound or self-serve SaaS businesses where pipeline analytics is replaced by product-led growth metrics (trial conversion, activation) — this dashboard is optimized for relationship-driven B2B sales
By the numbers

Metrics That Drive Decisions

Real impact, clearly measured. These KPIs show the tangible outcomes of data-informed strategy.

Pipeline Value

$8.4M

Total value of all open opportunities in the pipeline across all stages

+12% vs prior quarter

Win Rate

34.2%

Percentage of qualified opportunities closed as won over the selected period

Target: 35% — within range

Avg Deal Size

$47K

Average contract value of closed-won deals — indicator of upmarket motion health

+$3K vs last quarter

Quota Attainment

78%

Percentage of total quota achieved by the sales team for the current quarter

Q3 — 6 weeks remaining

From challenge to success

From Five Salesforce Reports to One Pipeline View

How we turned fragmented data into a single source of truth—and what we achieved.

The challenge

Charlotte's B2B sales teams — financial services firms, SaaS companies, and commercial real estate operators — run their pipeline reviews out of a mix of Salesforce saved reports, Excel pivot tables, and manually built slide decks. The Monday pipeline meeting starts 20 minutes late because the RevOps analyst is still pulling the stage conversion report. Win Rate is calculated differently by every sales manager. Deal age sits in a Salesforce field that nobody checks until a deal has been stalled for 90 days. Quota attainment updates once a week when someone manually exports to Excel.

  • Salesforce contains all opportunity data but pipeline visibility requires 4-5 separate reports — stage distribution, rep attainment, deal age, close-date slip — none of which talk to each other in a single view
  • Win Rate is inconsistently defined across sales managers (some include SQL stage, others only count SAL-qualified opps) — leading to conflicting numbers in weekly pipeline calls
  • Deal age alerts don't exist in standard Salesforce — stalled deals only surface when a rep manually checks their pipeline or when a manager asks directly
  • Quota attainment vs pipeline coverage comparison requires manually joining the CRM export with a quota spreadsheet — typically done by RevOps once a week

Our approach

We connect your CRM (Salesforce, HubSpot, or Dynamics 365) to a Power BI pipeline dashboard that updates hourly. Sales managers see pipeline value by stage, rep, and team in one view — no switching between Salesforce reports. Win Rate and stage conversion are calculated consistently across the entire team. Deal age distribution surfaces stalled deals before they die. Quota attainment updates automatically as opportunities close.

  • Connect Salesforce (via Power BI Salesforce connector or REST API), HubSpot (REST API), or Dynamics 365 (OData API) with hourly refresh for live pipeline visibility
  • Define Win Rate, stage conversion, and pipeline coverage consistently as DAX measures — one definition, applied uniformly across all reps and teams
  • Build deal age distribution chart that surfaces opportunities by days-in-stage so managers see stalled deals without waiting for a rep to flag them
  • Load quota targets from your spreadsheet or CRM into the model so quota attainment updates automatically when deals close — no weekly manual export

What we achieved

Monday pipeline review prep time reduced from 45 minutes to zero — RevOps analyst reads the dashboard instead of building the deck
Deal age monitoring surfaced 7 stalled Enterprise opportunities in week 1 — 3 were re-engaged and 2 advanced to proposal within 30 days
Win Rate definition disagreement eliminated — one calculated measure, same number for every manager in every meeting
Pipeline coverage ratio visibility enabled sales manager to reallocate two SDRs to the Enterprise team 6 weeks before quarter end, contributing to Q3 quota attainment
Rep-level quota attainment accuracy improved from ±8% (weekly manual) to real-time as each deal closes
Results verifiedRead full case study

Frequently Asked Questions

Find answers to common questions about this dashboard and our process.

We support Salesforce (via the native Power BI Salesforce connector or REST API), HubSpot (REST API), Microsoft Dynamics 365 Sales (OData API), and Pipedrive (REST API). For organizations using custom CRMs or CRMs not listed, we evaluate the available data export or API and determine feasibility in the scoping call. Most systems that allow a scheduled data export or have an API can be connected.

From Lets Viz

Ready to Transform Your Data?

Let's build something extraordinary together. Book a free consultation with our experts today.