Gross Collection Rate
97.3%
Net collections as % of net charges after contractual adjustments
▲ +0.8 pts QoQ
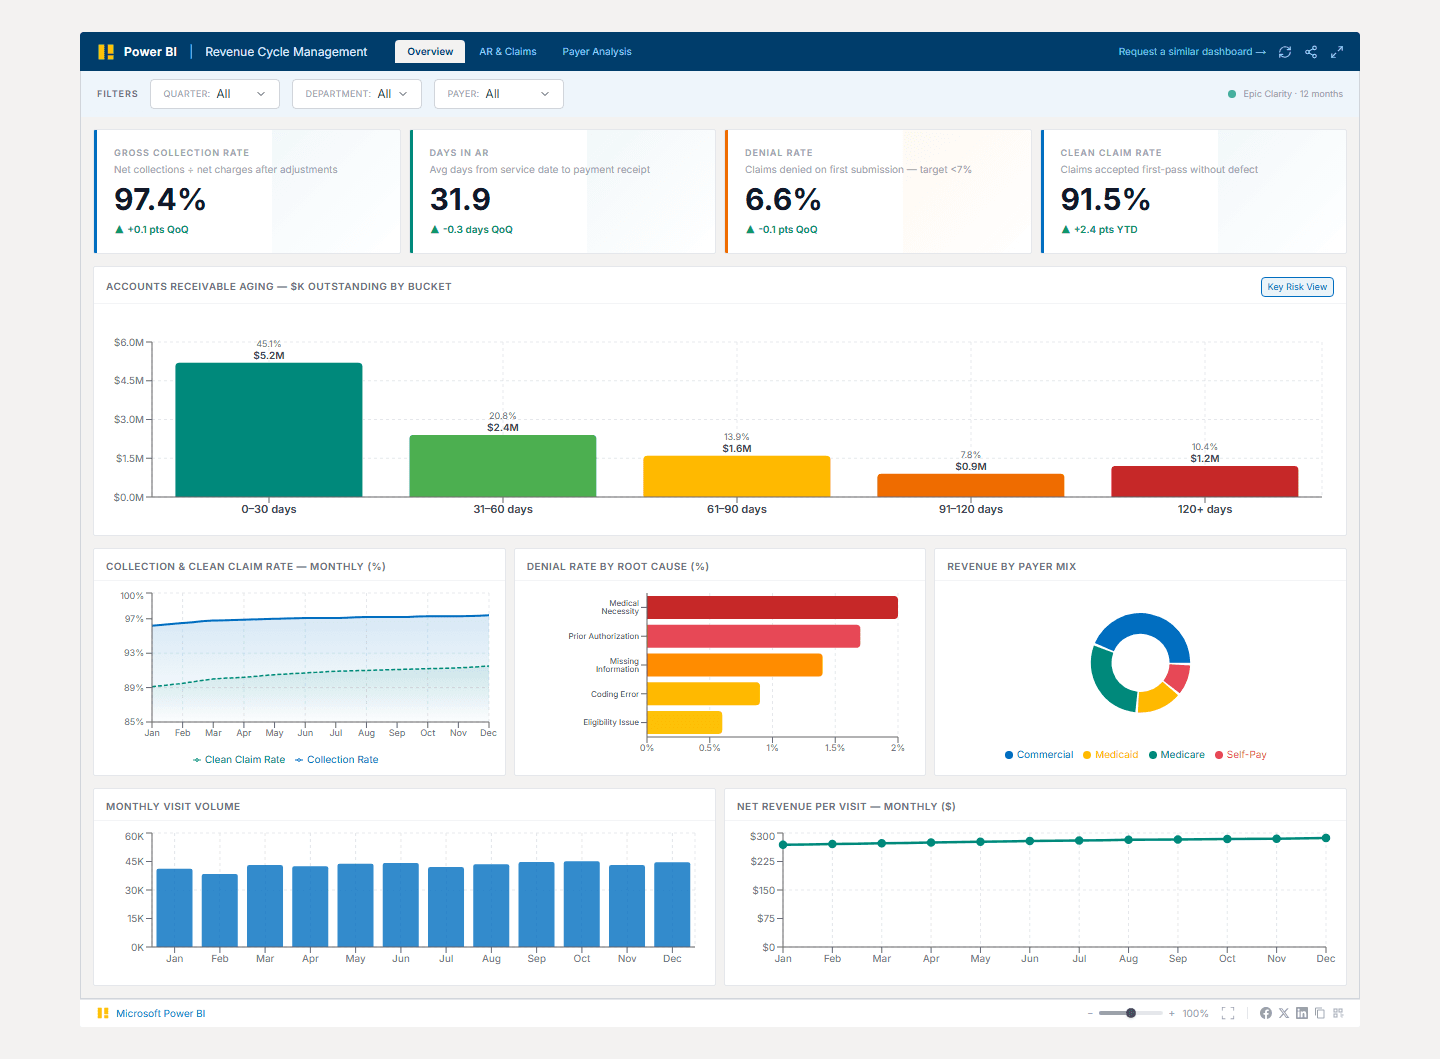
Real-time claim performance, AR aging, denial root causes, and payer mix analytics — from Epic and your clearinghouse to Power BI in under 48 hours.
Built for healthcare CFOs, RCM directors, and billing managers who need accurate, trusted visibility into claim performance, cash velocity, and denial patterns across every department and payer.
Powered by Power BI, connected to Epic, Cerner, Waystar, Availity, and your billing system.
Trusted by teams across 15+ countries
Five indicators every RCM director and healthcare CFO monitors daily — tracking claim velocity, denial exposure, and net revenue per encounter.
97.3%
Net collections as % of net charges after contractual adjustments
▲ +0.8 pts QoQ
32.4
Average days from date of service to payment receipt
▲ -1.8 days QoQ
6.8%
Claims denied on first submission — HFMA benchmark is under 5%
▲ -0.4 pts QoQ
$284
Net collections divided by total billable encounters this period
▲ +3.2% QoQ
91.2%
Claims accepted by payer on first pass without defect or correction
▲ +0.9 pts QoQ
Healthcare billing teams waste hours every week reconciling claim status across multiple clearinghouse portals, ERA files, and EHR reports — often catching denial patterns weeks too late to act on.
A 300-provider Dallas-area health system was tracking denial rates from a monthly Waystar report, reconciling AR aging in Excel, and calculating collection rates by pulling data from three separate Epic billing modules. The billing director had a different collection rate number than the CFO every month — because each used a different denominator definition. Denial root-cause analysis was a 4-hour manual process run only after month close.
We built a Power BI semantic model on top of a staging layer connected to Epic Clarity, Waystar clearinghouse API, and the health system's billing database. The dashboard calculates gross collection rate, days in AR, denial rate by reason code, and payer mix using definitions aligned with the CFO and billing director before any DAX was written.
Questions we hear from healthcare CFOs and RCM leaders before starting a revenue cycle analytics engagement.
We connect to Epic (via Clarity database or Chronicle reporting workbench), Cerner (PowerChart and Revenue Cycle), and Allscripts on the EHR side. For clearinghouses, we integrate with Waystar (Relay Health), Availity, Change Healthcare, and Optum. We can also pull from your practice management system (AdvancedMD, athenahealth, Kareo) if the EHR is separate. The exact connector set is confirmed during scoping.
From Lets Viz
Most health systems are 7–10 business days away from a real-time RCM command center. Book a free scoping call and we'll confirm your EHR, clearinghouse, and billing system landscape.
BAA-ready · NDA-safe · No obligation · Clear delivery timeline