Total Generation (YTD)
2.96 TWh
Total electricity generated across solar, wind, and hydro assets year-to-date
▲ +8.4% vs 2023
Generation, uptime, and ESG impact across your entire solar, wind, and hydro portfolio -- in one Power BI report.
Built for renewable energy asset managers and operations teams in Austin, West Texas, and the Gulf Coast who need accurate generation intelligence, ISO settlement reconciliation, and ESG-ready CO2 reporting.
Powered by Power BI, connected to SCADA/EMS, ISO settlement data, and ESG reporting frameworks (GRI, TCFD).
Trusted by teams across 15+ countries
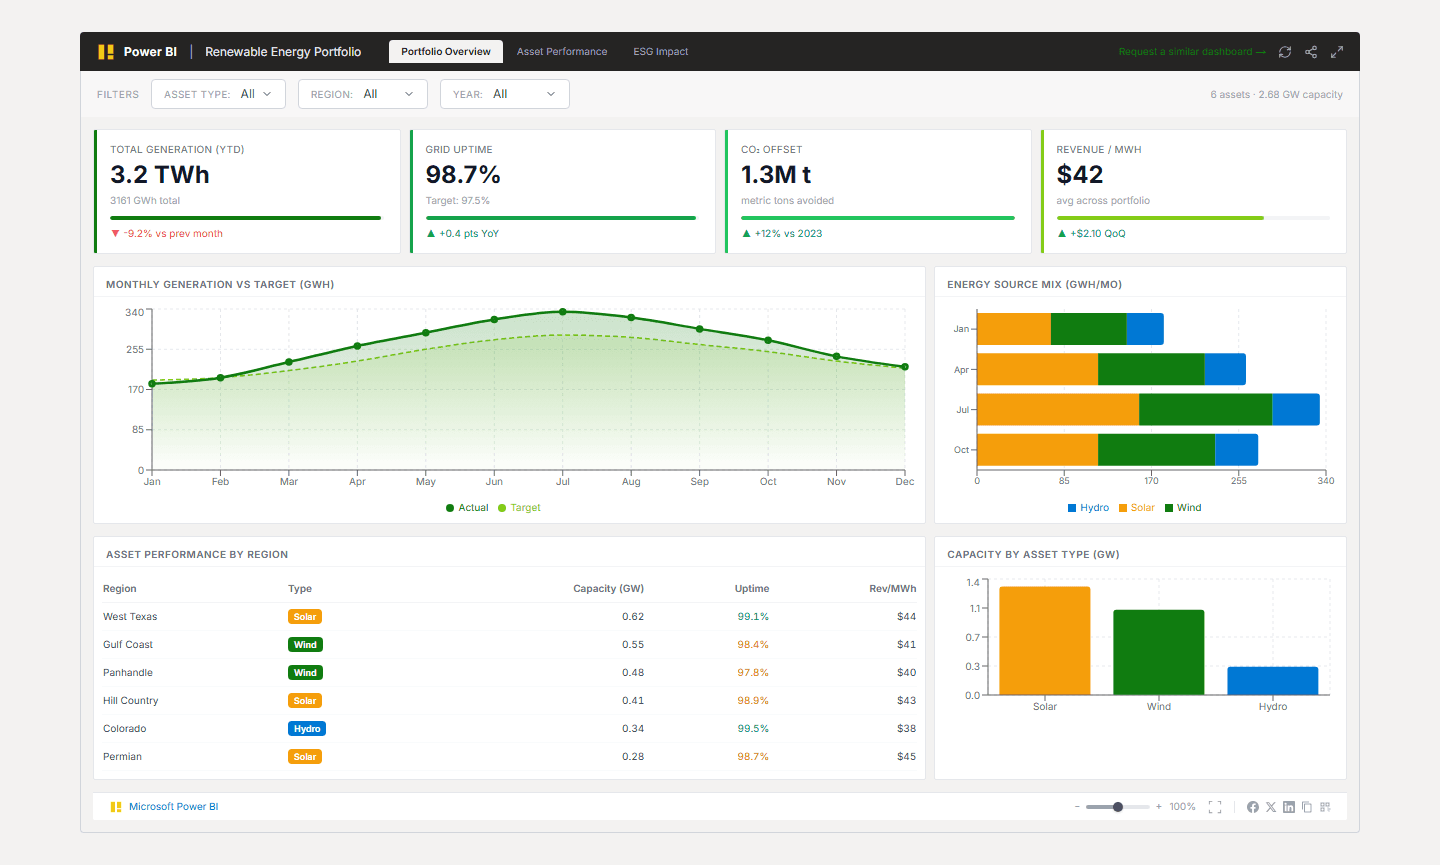
Four metrics every renewable energy portfolio manager and ESG lead tracks daily -- updated automatically from SCADA/EMS and ISO settlement feeds.
2.96 TWh
Total electricity generated across solar, wind, and hydro assets year-to-date
▲ +8.4% vs 2023
98.7%
Portfolio-wide asset availability -- target is 97.5%; measured against calendar hours
▲ +0.4 pts YoY
1.24M tonnes
Metric tonnes of CO2 equivalent avoided versus grid-average emission factor
▲ +12% vs 2023
$42.10
Blended average revenue per megawatt-hour across all asset types and markets
▲ +$2.10 QoQ
Renewable energy operators in Texas and the Gulf Coast are managing solar, wind, and hydro assets across multiple SCADA systems, ISO settlement portals, and ESG reporting templates -- with no unified view of generation performance.
A mid-size independent power producer with 2.4 GW across six Texas assets was generating daily SCADA exports from three different vendor systems, reconciling against ERCOT settlement statements in Excel, and building ESG impact reports in PowerPoint for quarterly board reviews. The generation team, finance team, and ESG officer each used a different number for the same portfolio.
We built a Power BI semantic model on a unified staging layer pulling from GE SCADA (via REST API), ERCOT settlement XML downloads, and a custom CO2 calculation engine using EPA eGRID emission factors. All three asset types (solar, wind, hydro) feed the same model with normalized GWh units and UTC timestamps.
Questions we hear from renewable energy asset managers and operations teams before starting an engagement.
We connect to GE SCADA (via Predix REST API), Siemens SINEMA, ABB Ability, and OSIsoft PI for real-time generation data. For legacy DAS systems with scheduled exports, we use Azure Data Factory to ingest CSV/XML drops to a staging lake. ISO settlement data is pulled via ERCOT CDRM (Texas), CAISO OASIS (California), or MISO direct download, depending on your market. The exact connector set is confirmed during scoping.
From Lets Viz
Most renewable energy asset managers are 10-14 business days away from a real-time generation command center. Book a free scoping call and we will confirm your SCADA sources, ISO market, and ESG reporting requirements.
NDA-safe · No obligation · Clear delivery timeline