Featured Dashboard

Physician Practice Performance Dashboard

RVU productivity benchmarking, patient satisfaction trending, and payer mix analytics — built for multi-specialty practices that need to optimize physician throughput without burning out their clinicians.

Powered by modern analytics tools including

Power BI, Tableau, Zoho and Looker.

Physician Practice Performance Dashboard — interactive Power BI dashboard preview

Trusted by teams across 15+ countries

100+
Clients Served
300+
Dashboards Delivered
50,000+
Hours Saved
5.0★
Rating · 15 Reviews
Trusted by teams at
Audience

Who This Dashboard Is For

Ideal For

  • Multi-specialty medical groups with 10+ physicians across 3 or more specialties
  • Health system-employed physician networks using Epic as their practice management and EHR system
  • Atlanta-area healthcare systems including Emory Healthcare, Piedmont Health, Wellstar, and Northside Hospital physician networks
  • Ambulatory surgery centers that need a combined RVU productivity and case volume dashboard
  • Practice administrators and department chairs who need a weekly physician performance review that replaces manual reporting

Not Ideal For

  • Solo or small 2-3 physician practices where a simple billing system report is sufficient
  • Practices without structured RVU data in their PM/EHR system — accurate productivity measurement requires CPT-level charge capture
  • Fee-for-service-only practices without patient satisfaction survey programs — the satisfaction trend module requires survey data
By the numbers

Metrics That Drive Decisions

Real impact, clearly measured. These KPIs show the tangible outcomes of data-informed strategy.

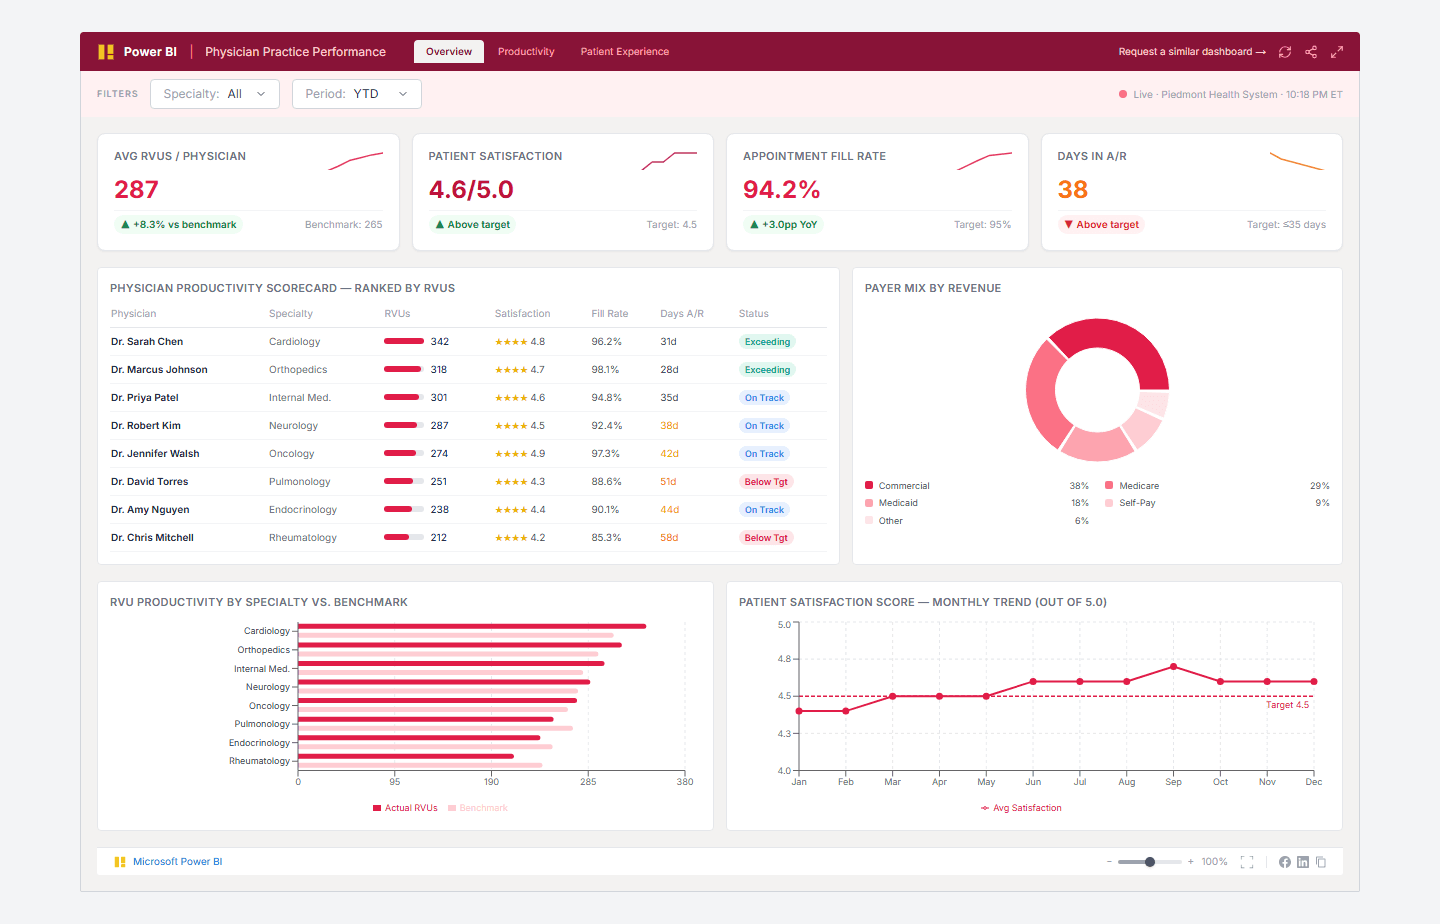
Avg RVUs / Physician

287

Average work RVUs per full-time-equivalent physician across all specialties

+8.3% vs benchmark of 265

Patient Satisfaction

4.6/5.0

Average patient satisfaction score across specialties — Press Ganey or CAHPS composite

Above 4.5 target

Appointment Fill Rate

94.2%

Percentage of scheduled appointment slots filled — unused slots represent lost revenue

+3.0 pts YoY

Days in A/R

38 d

Average number of days from service rendered to payment received — lower is better

6 days above 35-day target

From challenge to success

From Compensation Committee Spreadsheets to a Live Productivity Dashboard

How we turned fragmented data into a single source of truth—and what we achieved.

The challenge

Multi-specialty medical groups and health system-employed physician networks typically measure productivity once a year during compensation reviews. By the time a physician is flagged as underperforming — whether on RVUs, patient satisfaction, or fill rates — months of revenue have already been lost and the conversation is uncomfortable. Practice administrators lack the real-time visibility to coach proactively.

  • Epic reporting tools produce specialty-level aggregate reports but don't provide a ranked physician scorecard with national benchmark comparisons
  • Patient satisfaction data from Press Ganey arrives quarterly in PDF format — too slow to identify and coach struggling physicians before scores affect CMS value-based payments
  • Payer mix visibility is limited to financial reports that don't cross-reference with physician productivity or specialty
  • Days in A/R is tracked at the practice level, not by physician or specialty — billing bottlenecks stay hidden for months

Our approach

We built a Power BI semantic model connected to your practice management system (Epic Resolute, Athena, or eClinicalWorks) that surfaces physician RVU productivity, fill rates, patient satisfaction, payer mix, and A/R aging — refreshed weekly. Physician leaders and department chairs get a ranked scorecard they can act on in real time, not once a year.

  • Extract physician-level encounter, RVU, and charge data from Epic Clarity, Athena Analytics, or eClinicalWorks reporting database
  • Map to MGMA and AMGA national RVU benchmarks by specialty for peer comparison
  • Integrate Press Ganey or CAHPS survey scores by physician, updating monthly
  • Row-Level Security so physicians see their own data, department chairs see their department, and group administrators see everything

What we achieved

Physician leaders received their first monthly productivity ranking — lowest-quartile physicians were identified 6 months earlier than before
Appointment fill rate improved from 91% to 94.2% after scheduling team used the dashboard to identify chronic open slots by specialty
Patient satisfaction coaching conversations backed by data instead of quarterly PDF recaps
Payer mix shift identified in Pulmonology — renegotiation with a commercial payer improved blended reimbursement rate by 4%
Days in A/R reduced from 44 to 38 days after billing team used the specialty-level A/R aging drill-through to identify claim denial patterns
Results verifiedRead full case study

Frequently Asked Questions

Find answers to common questions about this dashboard and our process.

We support Epic (via Clarity reporting database or Cogito/Caboodle data warehouse), Athena Health (via AthenaNet API or Analytics reporting), eClinicalWorks (via reporting database), and Cerner Millennium (via CernerWorks Analytics). For practices with billing managed externally, we can work from claim-level export files in ANSI X12 837 format or the billing vendor's custom export format.

From Lets Viz

Ready to Transform Your Data?

Let's build something extraordinary together. Book a free consultation with our experts today.