Total Portfolio
$4.24B
Outstanding loan balance across all segments and risk grades
▲ +2.1% QoQ
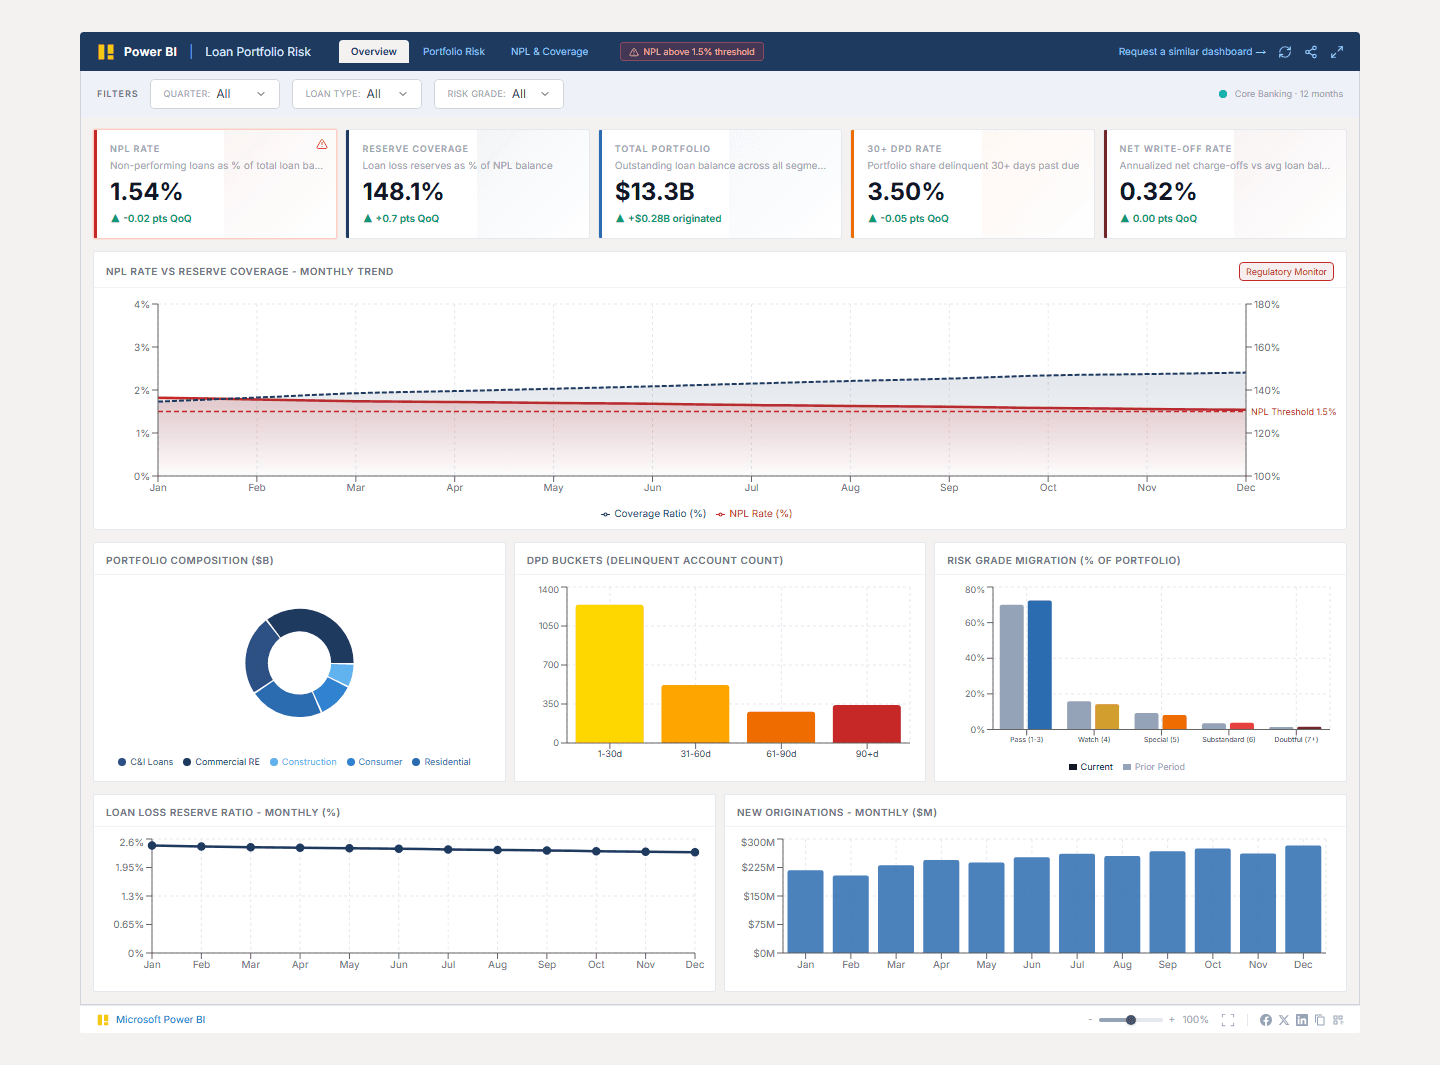
Real-time NPL ratio, CECL reserve coverage, delinquency aging, and risk grade migration — from your core banking system to Power BI in under 48 hours.
Built for Chief Credit Officers, risk managers, and bank CFOs who need accurate, trusted visibility into portfolio credit quality, delinquency trends, and regulatory compliance posture.
Powered by Power BI, connected to Fiserv, FIS, Jack Henry, nCino, and your CECL model.
Trusted by teams across 15+ countries
Five indicators every Chief Credit Officer and bank CFO monitors daily — tracking portfolio quality, reserve adequacy, and delinquency exposure in real time.
$4.24B
Outstanding loan balance across all segments and risk grades
▲ +2.1% QoQ
1.24%
Non-performing loans as % of total portfolio — FDIC Call Report basis
▲ -0.18 pts YTD
1.58%
Allowance for credit losses as % of outstanding loan balance
▲ 1.27x NPL coverage
10.8%
Risk grades 4-5 (Watch and Special Mention) as % of total portfolio
▲ -1.6 pts YTD
2.14%
Portfolio share with payments 30+ days past due — indicator of stress
▲ -0.24 pts YTD
Banking credit teams waste days each month manually compiling NPL ratios, delinquency aging reports, and risk grade migration summaries from core banking extracts — often presenting stale data at ALLL/CECL committee meetings.
A Texas regional bank with a $4.2B loan portfolio was generating its monthly credit quality report by exporting data from FIS core banking, running it through a 47-tab Excel model, and presenting results two weeks after quarter-end. The Chief Credit Officer and CFO were routinely presenting different NPL ratios because each used a different calculation date. Risk grade migration was tracked in a separate SharePoint document, updated manually by the loan review team.
We built a Power BI semantic model on top of a daily extract from FIS core banking, integrated with the bank's CECL model output and loan review system. NPL ratio, delinquency aging, and reserve coverage ratio are all calculated using agreed-upon definitions encoded in DAX — so the same number appears in the board package, the ALLL committee deck, and the DFAST submission.
Questions we hear from credit risk leaders and bank CFOs before starting a loan portfolio analytics engagement.
We connect to FIS (Horizon, IBS, and Systematics), Fiserv (Precision, DNA, Portico), Jack Henry (Silverlake, CIF20/20), and nCino for loan origination data. For community banks on legacy platforms, we use the system's native ODBC export or scheduled file drop to a secure staging database. The exact connector is confirmed during scoping — if your core banking system generates a standard loan tape (loan ID, balance, risk grade, DPD, collateral type), we can build from it.
From Lets Viz
Most regional banks are 7–10 business days away from a real-time loan portfolio risk command center. Book a free scoping call and we'll confirm your core banking system, CECL model, and reporting requirements.
NDA-safe · No obligation · FDIC/OCC exam-ready documentation