Sites Active
6 sites
Clinical sites open and enrolling across Phase II and III cohorts
▲ +2 added this quarter
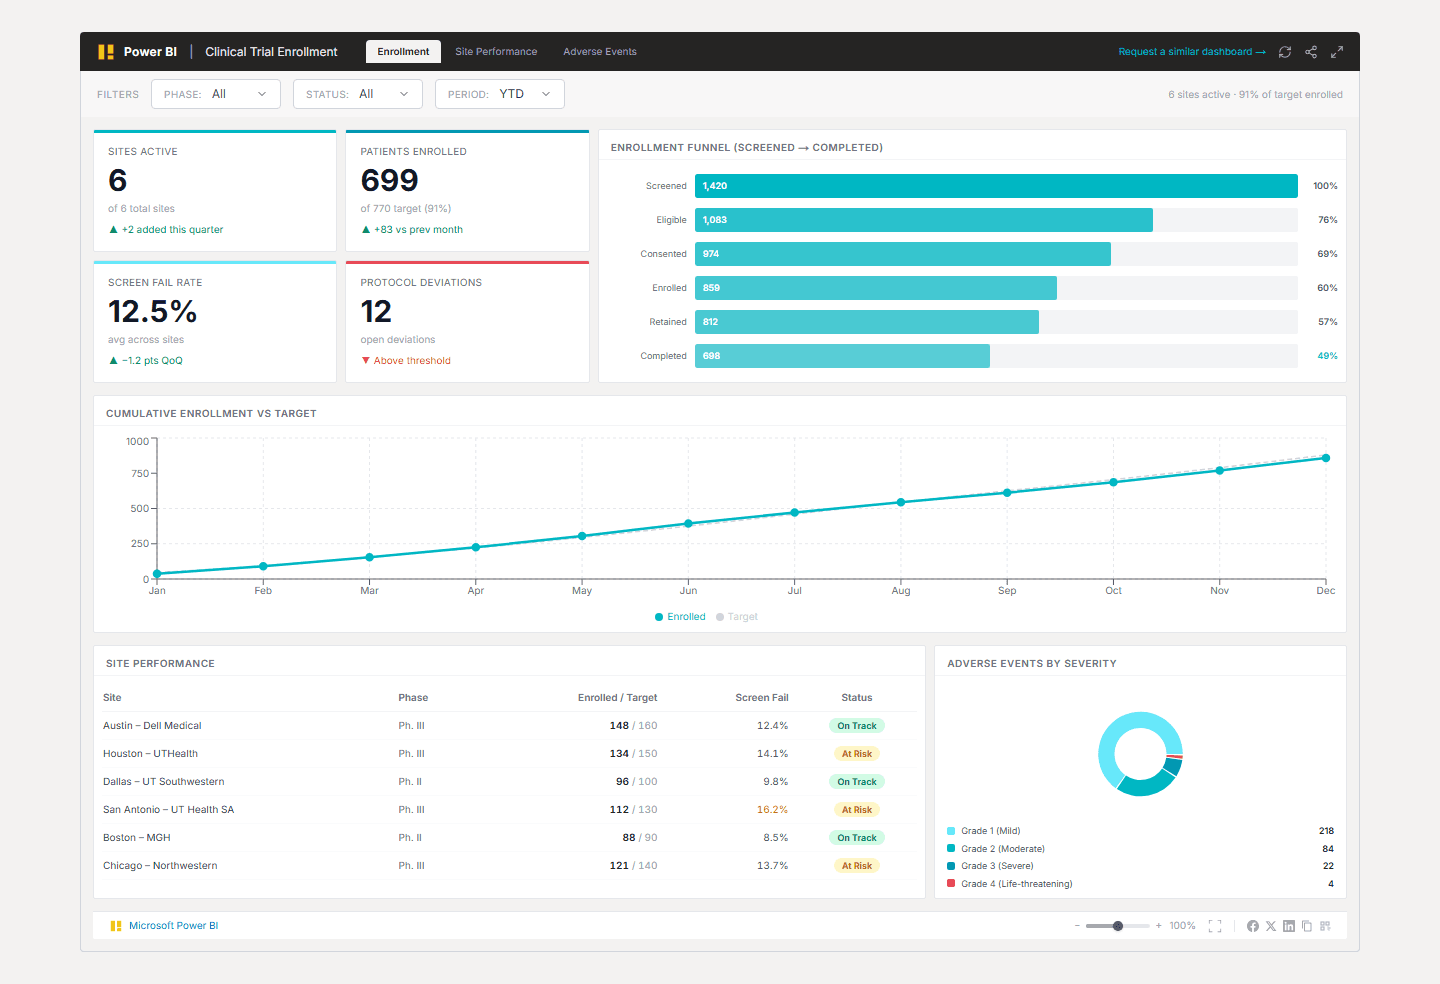
Patient enrollment, site performance, and safety signals -- in one GCP-compliant Power BI dashboard for multi-site trials.
Built for clinical operations teams, CROs, and biotech sponsors running Phase II and III trials who need real-time enrollment tracking, screen fail root-cause analysis, and protocol deviation monitoring across all sites.
Powered by Power BI, connected to EDC systems (Medidata Rave, Veeva Vault CTMS, Oracle Clinical), GCP-compliant data access.
Trusted by teams across 15+ countries
Four indicators every clinical operations manager and CRO tracks weekly -- pulled automatically from your EDC and CTMS and updated each morning before the site management call.
6 sites
Clinical sites open and enrolling across Phase II and III cohorts
▲ +2 added this quarter
859
Total patients enrolled and randomized across all active sites and phases
▲ +83 vs prev month
13.1%
Percentage of screened patients who did not meet eligibility criteria
▲ -1.2 pts QoQ
12 open
Open protocol deviations across all sites -- reviewed by medical monitor weekly
▲ Within threshold
Clinical operations teams at Austin-area CROs and biotech sponsors are managing multi-site trials with enrollment data living in Medidata Rave, site visit reports in SharePoint, and adverse event logs in a separate safety database -- with no unified view of trial health.
A Phase III oncology trial with six sites across Texas and the Northeast was reconciling weekly enrollment numbers from Medidata Rave EDC exports, screen fail logs from site coordinators in Excel, and protocol deviation reports from the medical monitor in a Word document. The sponsor's clinical operations team spent 6 hours before every data review meeting reconciling numbers that were 3-5 days stale by the time they arrived.
We built a Power BI semantic model that ingests Medidata Rave EDC patient data (via REST API), CTMS site targets, and the safety database AE extract. All three sources are joined on Subject ID and Site ID, giving one row per patient with enrollment status, screen fail reason, deviations, and AE severity visible on the same canvas.
Questions we hear from clinical operations teams and CROs before starting a trial analytics engagement.
We connect to Medidata Rave (via dataset-based REST API), Veeva Vault CTMS, Oracle Clinical, and OpenClinica. For sponsors using SAS-format data exports (CDISC CDASH/SDTM), we ingest via scheduled dataset drops to Azure Blob Storage. CTMS integrations include Veeva Vault eTMF, Parexel Informatics, and SharePoint-based site tracking workbooks. The exact connector set is confirmed during scoping and depends on your existing system landscape.
From Lets Viz
Most clinical operations teams are 10-14 business days away from a real-time trial command center. Book a free scoping call and we will confirm your EDC system, CTMS, and safety data sources.
NDA-safe · No obligation · Clear delivery timeline