Featured Dashboard

Branch & Product Performance Dashboard

Ranked branch leaderboards, NIM trend tracking, and product mix analytics — built for regional banks and credit unions competing for deposits in the Atlanta market and beyond.

Powered by modern analytics tools including

Power BI, Tableau, Zoho and Looker.

Branch & Product Performance Dashboard — interactive Power BI dashboard preview

Trusted by teams across 15+ countries

100+
Clients Served
300+
Dashboards Delivered
50,000+
Hours Saved
5.0★
Rating · 15 Reviews
Trusted by teams at
Audience

Who This Dashboard Is For

Ideal For

  • Regional and community banks with 5 to 100 branch networks managing deposits, loans, and product cross-sell
  • Credit unions competing for household wallet share in the Atlanta metro and Southeast region
  • Bank CFOs, retail banking heads, and market presidents who need a weekly branch performance review deck that updates itself
  • FIS, Fiserv, or Jack Henry customers who want Power BI analytics on top of their core banking transaction data
  • Atlanta-area banks managing rapid deposit growth from commercial real estate and healthcare sector expansion

Not Ideal For

  • Single-branch community banks where a simple Excel report is sufficient — the ROI of a full Power BI semantic model requires at least 5 branches
  • Digital-only neobanks without branch-level cost allocation — this dashboard is built for physical branch economics
  • Banks without access to daily balance data — the NIM trend and deposit monitoring features require at least daily data extracts
By the numbers

Metrics That Drive Decisions

Real impact, clearly measured. These KPIs show the tangible outcomes of data-informed strategy.

Total Deposits

$4.2B

Total deposit balance across all Atlanta-region branches

Up 10.0% YoY

Loan Portfolio

$2.8B

Total loans outstanding including mortgage, commercial, and consumer

Up 11.4% YoY

Net Interest Margin

3.42%

Net interest margin vs. Southeast community bank peer average of 3.27%

+14bps above peer avg

Cross-Sell Ratio

2.7x

Average number of products per household — target 3.0x for peer-leading performance

+0.3x vs last year

From challenge to success

From Monthly Branch Reports to a Real-Time Performance Leaderboard

How we turned fragmented data into a single source of truth—and what we achieved.

The challenge

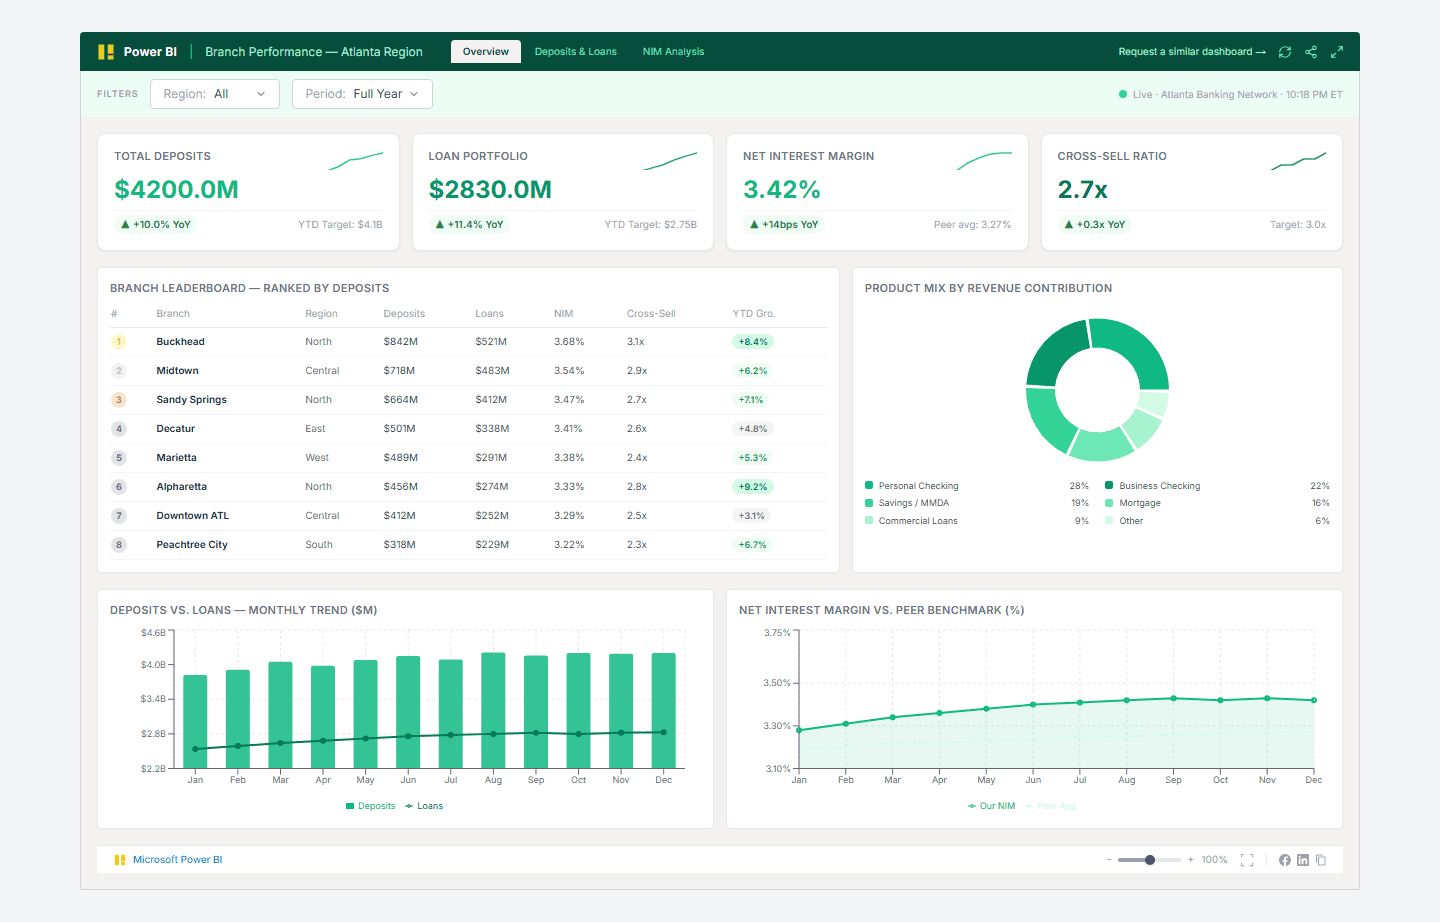
Regional bank CFOs and retail banking heads receive branch performance data weeks after the fact — a PDF from the core system that doesn't rank branches, doesn't drill into product mix, and doesn't show NIM trend by region. Branch managers have no way to see how they stack up against peers, and deposit growth initiatives lack accountability.

  • Core banking systems produce fixed-format reports that can't rank branches or drill into product profitability
  • NIM is calculated monthly in Excel, not tracked daily against peer benchmarks
  • Cross-sell ratios are reported per quarter, not monitored continuously — opportunities to coach underperforming branches are missed
  • Atlanta market competition for deposits is intensifying; banks without real-time deposit tracking lose rate-sensitive balances before the monthly report arrives

Our approach

We built a Power BI semantic model connected to your core banking system (FIS, Fiserv, or Jack Henry) that surfaces branch-level deposits, loans, NIM, and cross-sell ratios in a live leaderboard — refreshed daily. The dashboard includes a product mix pie chart, deposits vs. loans trend line, and NIM vs. peer benchmark tracking that management can present in the Monday morning call.

  • Connect to core banking data warehouse (FIS IBS, Fiserv DNA, or Jack Henry Symitar) via ODBC or daily export
  • Build branch hierarchy with region rollups and peer group assignments
  • Calculate NIM at the branch level using daily average balance and interest rate data
  • Product mix segmentation by household, aligned to your product catalog

What we achieved

Branch managers received their first real-time performance ranking, enabling peer accountability
NIM tracking moved from monthly Excel calculation to daily dashboard — rate compression was identified 3 weeks earlier than the prior process
Cross-sell ratio improved from 2.4x to 2.7x across the Atlanta network within 6 months of go-live
Top 3 branch managers identified and recognized publicly — retention improved in a competitive hiring market
Deposit concentration risk identified at one branch; balance transfer program launched proactively
Results verifiedRead full case study

Frequently Asked Questions

Find answers to common questions about this dashboard and our process.

We support FIS IBS and Modern Banking Platform (via data warehouse or ODBC), Fiserv DNA and Signature (via Fiserv Analytics or direct query), and Jack Henry Symitar (via ArgoKontingent or data exports). We also work with banks that have already staged their core data into a data warehouse (Azure SQL, Snowflake, or Databricks). The integration method is confirmed during the scoping call.

From Lets Viz

Ready to Transform Your Data?

Let's build something extraordinary together. Book a free consultation with our experts today.