Using UNICHAR DAX Function in Power BI
What the purpose of UNICHAR DAX Function in Power BI?
In Power BI, small design elements can significantly enhance the visual appeal and usability of reports. Adding symbols, icons, or special characters can improve readability, simplify navigation, and make insights more impactful. While Power BI doesn’t offer built-in options for custom symbols, the UNICHAR DAX function provides an easy solution by enabling the use of Unicode characters.
Some practical applications include:
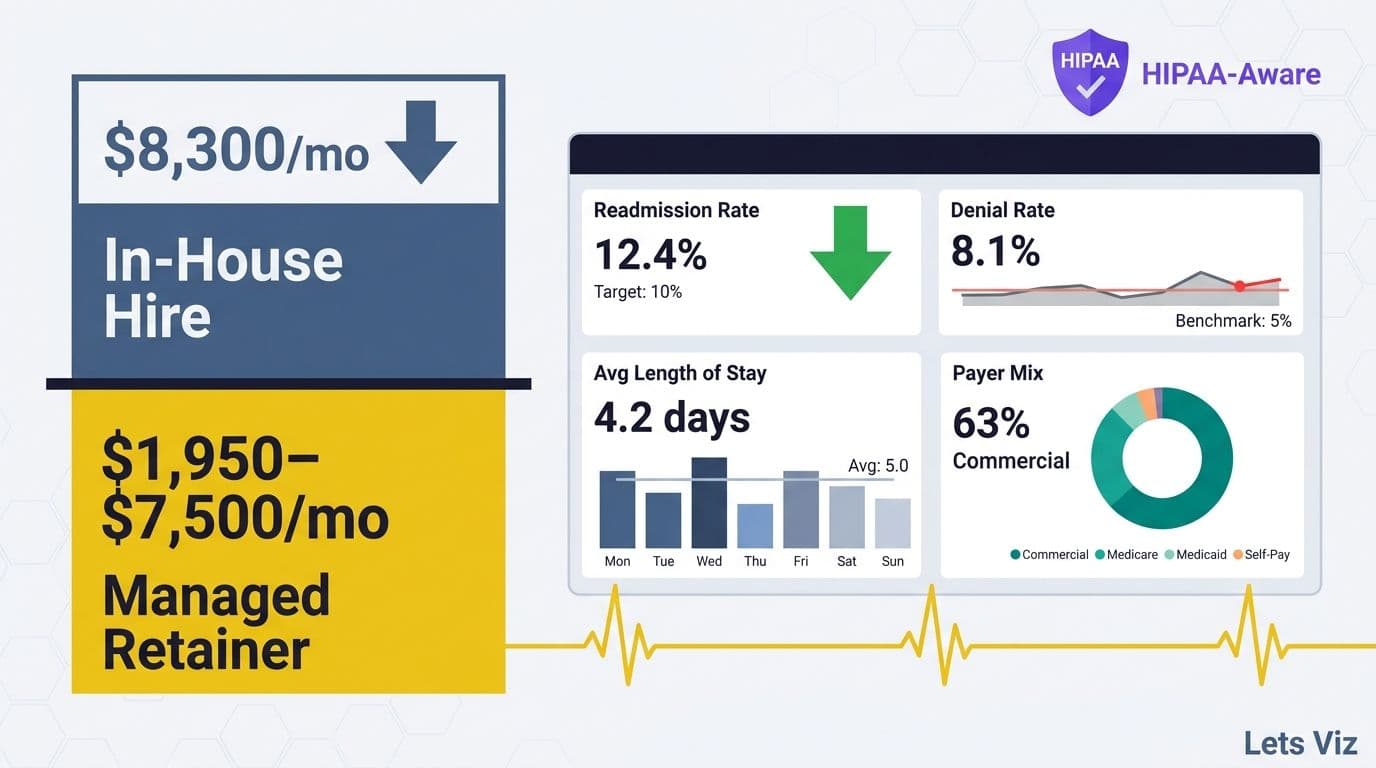
- Better Data Visualization: Display trends or alerts with arrows, checkmarks, or warning icons.
- Enhanced Visual Appeal: Add stars, bullets, or emojis for a more engaging design.
- Dynamic Indicators: Use Unicode characters in conditional formatting to emphasize key metrics.
In this blog, we’ll explore how to leverage the UNICHAR DAX function, its key use cases, and best practices for elevating your Power BI reports.
How to use UNICHAR DAX Function in Power BI?
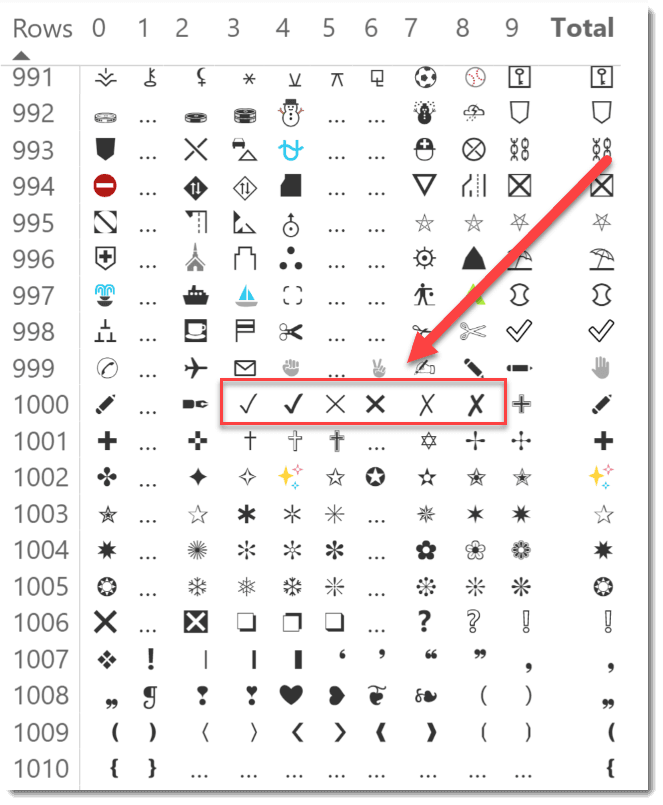
Overview of the Character and Function
- Determine the message you wish to convey, for instance, changes in performance or goal completion.
- Find a group of icons that effectively conveys the notion.
![]()
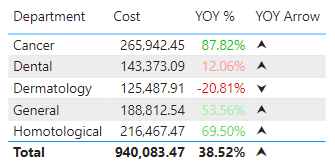
The table in the example below appears like the top picture when the aforementioned measure is added to it (shown again below).
As you can see, business intelligence has a lot to offer businesses of all sizes across all industries. If you’re not already using BI in your decision-making process, now is the time to start!
For more customizable options, feel free to reach out to our Power BI Consultant and explore tailored solutions to meet your specific needs.
Check out other helpful Power BI Blogs

If you are looking forward to getting your data pipeline built and setting up the dashboard for business intelligence, book a call now from here.
#analytics #data #business #artificialintelligence #machinelearning #startup #deeplearning #deeplearning #datascience #ai #growth #dataanalytics #india #datascientist #powerbi #dataanalysis #businessanalytics #businessanalyst #businessandmanagement #dataanalyst #businessanalysis #analyst #analysis #powerbideveloper #powerbidesktop #letsviz
Need a Power BI consultant for your team?
We've built Power BI dashboards and data automation for 100+ clients across finance, sales, operations, and executive reporting. Fixed-fee MVPs, first production dashboard in 3–4 weeks.
- Finance BI — P&L, balance sheet, budget vs actual, cash forecast
- Sales BI — CRM data cleaned, pipeline and forecast dashboards leadership trusts
- Operations BI — real-time KPIs with validation and alerting built in
- Embedded Power BI inside SaaS products with row-level security
See the Fortivis case study for a real example: an Athens-based financial advisory firm that replaced their multi-day manual reporting cycle with a validated Power BI pipeline.