Tableau – Design Flow

Tableau analyzes lots of data over time and also analyzes different measures and dimensions in the data set. While working on a visualization we have step by step process to draw all the aspects in the visualization. It becomes important to know all the steps of Tableau Design flow thoroughly to achieve the best of the dashboards.
Dashboards and stories are the final outcomes of the visualization but there are further more things that take place while them. There are many small steps that should be taken to have a proper outcome. So here in this article, we will know about the best approach to create effective and efficient dashboards and stories. Below is the Tableau Design flow diagram that we should follow while creating any workbooks or stories.
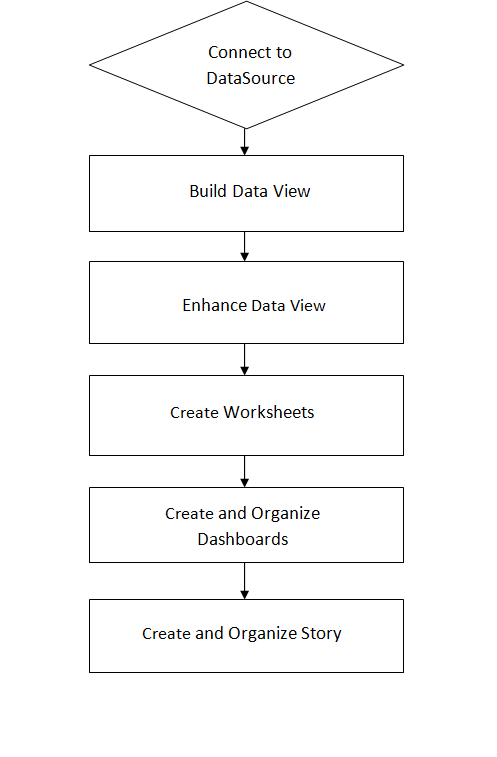
Now let’s briefly understand the Tableau Design flow as followed:-
1. Connect to Data Source: – The very first step of the Tableau Design flow is to connect with the data sources to Tableau. In Tableau, we can connect to every possible data such as Excel files, text files, relational files, and Cloud databases. etc. For connecting to any server we just need the credential and for local memory files, work can be done in just one click. Connecting to data is very easy in Tableau.
2. Build Data Views:- After connecting to the data source, next in the Tableau Design flow we need to build the view which means building a hierarchy of how the data will be flowing. Blending and adding relationships to the data is done in this step. We drag and drop the data field on the workspace for creating a relationship in the data set.
3. Enhance the Views:- When the view is built, it comes to a point where we should enhance the data to make it more smooth in working. Changing the headers, splitting the columns, and adding filters and borders are done in this step of the design flow.
4. Create Worksheets:- When the data is ready to work upon, we add sheets for creating worksheets. Here we use different charts, graphs, and formatting guidelines for analyzing the data using more visuals and animations.
5. Create and Organize Dashboards:- Dashboards are collections of different worksheets in a more systematic way. The worksheets in the dashboard should be adjusted in such a way that the dashboard should look more efficient and effective to the user.
6. Create a Story:- A story is a sequence of different worksheets and dashboards that are pilled closer to convey certain information to the user. As in the dashboard, we should worksheets/dashboards in a systematic way. A story helps in understanding the relationship between information, context, facts and how a decision is made about this information.
Check out other useful Tableau charts below:
- How to create a rounded bar chart in Tableau
- How to create a donut chart in Tableau
- Edit Table calculation in Tableau
- Switch Between YoY and MoM using Parameter Selection
- Add Map Layers in Tableau
- Create and synchronize dual axis in Tableau
Follow us on Twitter, Facebook, Linkedin, and Tableau Public to stay updated with our latest blog and what’s new in Tableau.