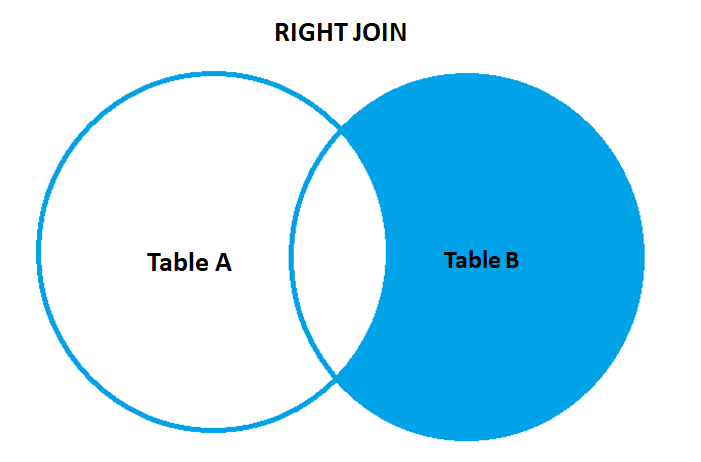
SQL RIGHT JOIN
SQL RIGHT JOIN returns all the records from the right table even if there is no match of the records with the right table. If there are no records found then the result set will carry NULL on the non-matched fields of the left table.
- Syntax of RIGHT JOIN –
SELECT column1,column2,column3,...,columnN FROM Table A RIGHT JOIN Table B ON Table A.column_name = Table B.column_name ;
Example – Consider these two tables the Product table and the Manager table.
Demo Table –
Product Table
| Category | Region | City | Country | Customer_ID | Customer_name |
| Office Supplies | Central | Chicago | United States | SM-20950 | Suzanne McNair |
| Technology | East | New York City | United States | AH-10465 | Amy Hunt |
| Office Supplies | East | New York City | United States | AH-10465 | Amy Hunt |
| Office Supplies | East | Dover | United States | EP-13915 | Emily Phan |
| Office Supplies | East | Dover | United States | EP-13915 | Emily Phan |
| Technology | West | Aurora | United States | TP-21565 | Tracy Poddar |
| Office Supplies | West | Aurora | United States | TP-21565 | Tracy Poddar |
| Office Supplies | East | Long Beach | United States | AR-10825 | Anthony Rawles |
| Office Supplies | West | Pasadena | United States | HA-14920 | Helen Andreada |
| Furniture | West | Pasadena | United States | HA-14920 | Helen Andreada |
Manager Table
| Region | Regional Manager |
| West | Sadie Pawthorne |
| East | Chuck Magee |
| Central | Roxanne Rodriguez |
| South | Fred Suzuki |
Now the below query will return all the records from the Manager table i.e (Right table) even if there is no match in the Product table i.e (Left Table).
SELECT A.Category,A.City,A.[Customer Name],B.Region,B.[Regional Manager] FROM [dbo].[Products$] AS A RIGHT JOIN [dbo].[Manager] AS B ON A.Region = B.Region ;
This output is the small section of the output by executing the above query of the SQL Right join –
| Customer_Name1 | Customer_Name2 | City |
| Aaron Bergman | Adam Bellavance | Seattle |
| Aaron Bergman | Adam Hart | Arlington |
| Aaron Bergman | Alan Hwang | Seattle |
| Aaron Bergman | Alejandro Ballentine | Seattle |
| Aaron Bergman | Alejandro Savely | Seattle |
| Aaron Bergman | Amy Cox | Seattle |
| Aaron Bergman | Andrew Gjertsen | Seattle |
| Aaron Bergman | Angele Hood | Seattle |
| Aaron Bergman | Ann Chong | Seattle |
| Aaron Bergman | Ann Steele | Seattle |
Follow us on Twitter, Facebook, Linkedin, and Tableau Public to stay updated with our latest blog and what’s new in Tableau.

If you are looking forward to getting your data pipeline built and setting up the dashboard for business intelligence, book a call now from here.
#analytics #data #business #artificialintelligence #machinelearning #startup #deeplearning #deeplearning #datascience #ai #growth #dataanalytics #india #datascientist #powerbi #dataanalysis #tableau #SQL #businessanalytics #businessanalyst #businessandmanagement #dataanalyst #businessanalysis #analyst #analysis #powerbideveloper #powerbidesktop #letsviz