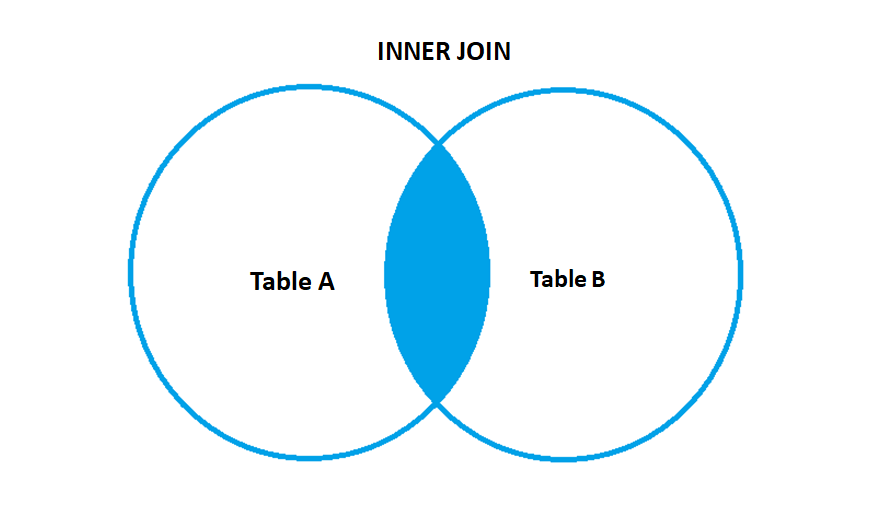
SQL INNER JOIN

INNER JOIN is the most frequently used join in SQL. These joins are also referred to as EQUIJOIN. It creates a new result set that comprises the matching records of the joined tables on the basis of joining ground. If the condition on the predicate meets then it will return the matched pair of rows of Table A and Table B.
- Syntax of INNER JOIN –
SELECT column1 , column2 , column3 , ... , columnN FROM Table A

INNER JOIN

Table B ON TableA.column_name = TableB.column_name ;
Example – Consider these two tables the Product table and the Manager table.
Product Table
| Category | Region | City | Country | Customer_ID | Customer_name |
| Office Supplies | Central | Chicago | United States | SM-20950 | Suzanne McNair |
| Technology | East | New York City | United States | AH-10465 | Amy Hunt |
| Office Supplies | East | New York City | United States | AH-10465 | Amy Hunt |
| Office Supplies | East | Dover | United States | EP-13915 | Emily Phan |
| Office Supplies | East | Dover | United States | EP-13915 | Emily Phan |
| Technology | West | Aurora | United States | TP-21565 | Tracy Poddar |
| Office Supplies | West | Aurora | United States | TP-21565 | Tracy Poddar |
| Office Supplies | East | Long Beach | United States | AR-10825 | Anthony Rawles |
| Office Supplies | West | Pasadena | United States | HA-14920 | Helen Andreada |
| Furniture | West | Pasadena | United States | HA-14920 | Helen Andreada |
Manager Table
| Region | Regional Manager |
| West | Sadie Pawthorne |
| East | Chuck Magee |
| Central | Roxanne Rodriguez |
| South | Fred Suzuki |
Now, let us suppose we want to know the Regional managers of the cities. Below is the statement that shows the results.
SELECT A.Category,A.City,A.[Customer Name],A.Region,B.[Regional Manager]

FROM [dbo].[Products] AS A

INNER JOIN [dbo].[Manager] AS B

ON A.Region = B.Region;
This output is the small section of the output by executing the above query –
| Category | City | Customer_ID | Region | Regional Manager |
| Office Supplies | Chicago | Suzanne McNair | Central | Roxanne Rodriguez |
| Technology | New York City | Amy Hunt | East | Chuck Magee |
| Office Supplies | New York City | Amy Hunt | East | Chuck Magee |
| Office Supplies | Dover | Emily Phan | East | Chuck Magee |
| Office Supplies | Dover | Emily Phan | East | Chuck Magee |
| Technology | Aurora | Tracy Poddar | West | Sadie Pawthorne |
| Office Supplies | Aurora | Tracy Poddar | West | Sadie Pawthorne |
| Office Supplies | Long Beach | Anthony Rawles | East | Chuck Magee |
| Office Supplies | Pasadena | Helen Andreada | West | Sadie Pawthorne |
| Furniture | Pasadena | Helen Andreada | West | Sadie Pawthorne |
Follow us on Twitter, Facebook, Linkedin, and Tableau Public to stay updated with our latest blog and what’s new in Tableau.

If you are looking forward to getting your data pipeline built and setting up the dashboard for business intelligence, book a call now from here.