How to do Serial Row Numbers in Power BI


Why serial row numbers are helpful?
- Maintaining Row Order: Power BI relies on sorting rules to organize data, but adding serial numbers ensures a consistent row order, especially when exporting data or aligning it with another dataset.
- Locating Row Positions: Serial numbers help pinpoint the exact position of rows in visuals or reports, making it easier to identify specific entries, such as top performers, or to filter data within a specific range.
- Improving Presentation: A sequential number column enhances the usability and readability of tables and matrices, making reports more intuitive for end users.
This blog will delve into the significance of serial row numbers in Power BI, explore methods to create them, and share best practices for integrating them effectively into your reports.
How to add Serial Row Numbers in Power BI?
Using a Power Query to create an Index column
You may add a serial number or row number column in Power BI by using a Power Query to add an Index column to your data, which acts as a row counter to the rows in your data table.
Note: Direct Query mode is not supported.
Let’s get going:
In order to build an Index column, adhere to the following steps:
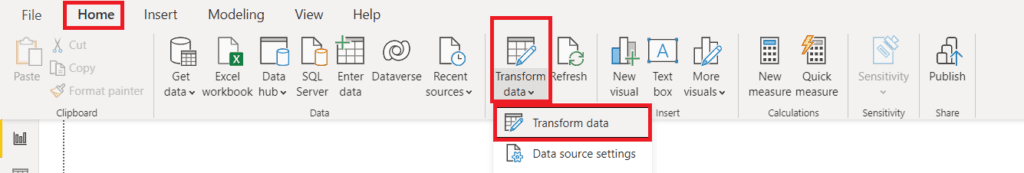
Step 1: Select the Home tab. Select Transform data. Select Change the data
Step 2: The Power Query Editor windows open. Choose your dataset. Add Column > Index Column
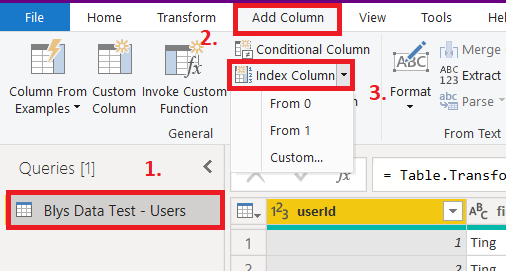
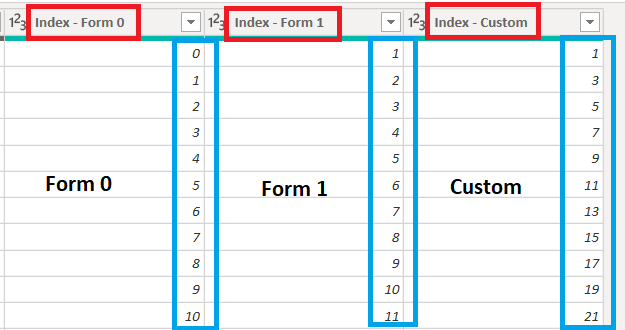
Step 3: The index column provides you with the following three options.
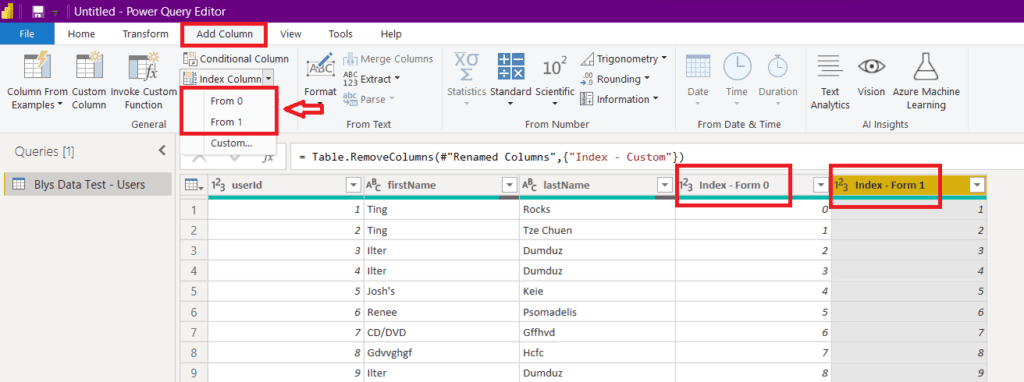
From 0 – It begins by adding the index at position 0.
From 1 – It begins by adding the index from position 1.
Custom – It allows you to choose the index’s initial value and increment.
Start Index From 0 & From 1
Select “From 0” or “From 1” from the Add column > Index Column menu.
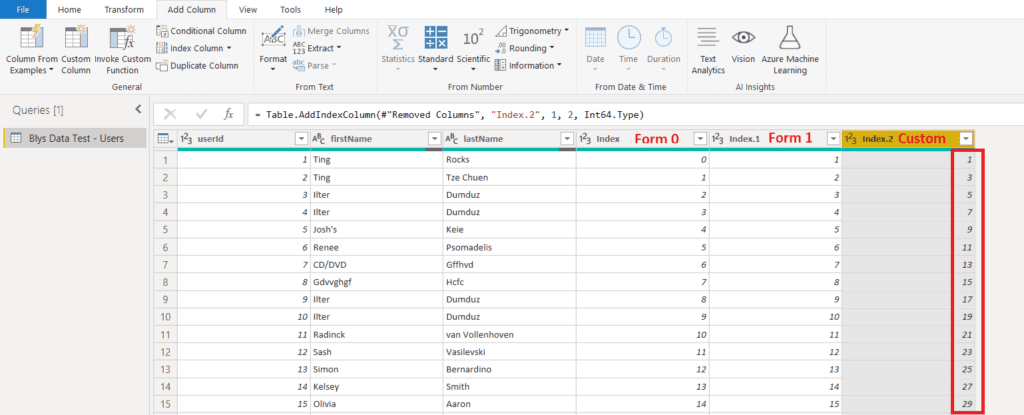
Custom Index
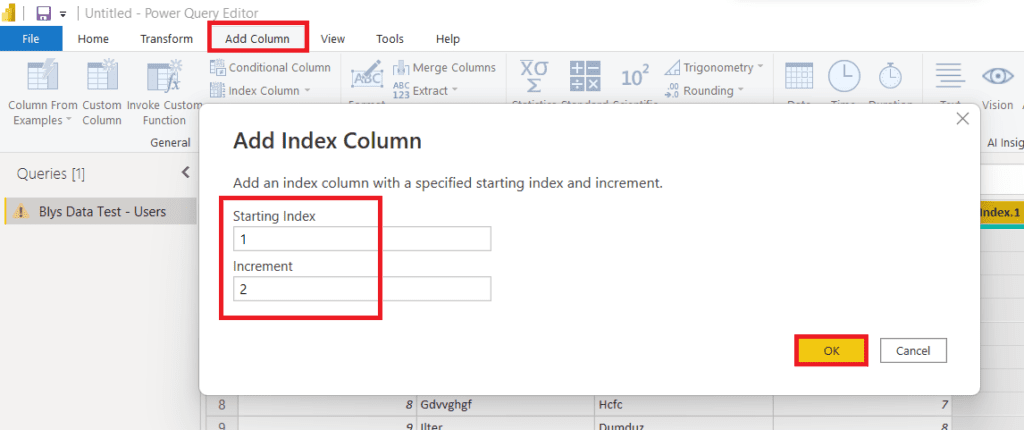
Select Custom Index under Add Column > Index Column.
The dialogue box for adding an index column opens; we have specified that the index should start at 1 and be increased by 2.
As a result, the index number for each subsequent row will be two increments higher than the index number for the row before it.
The Result
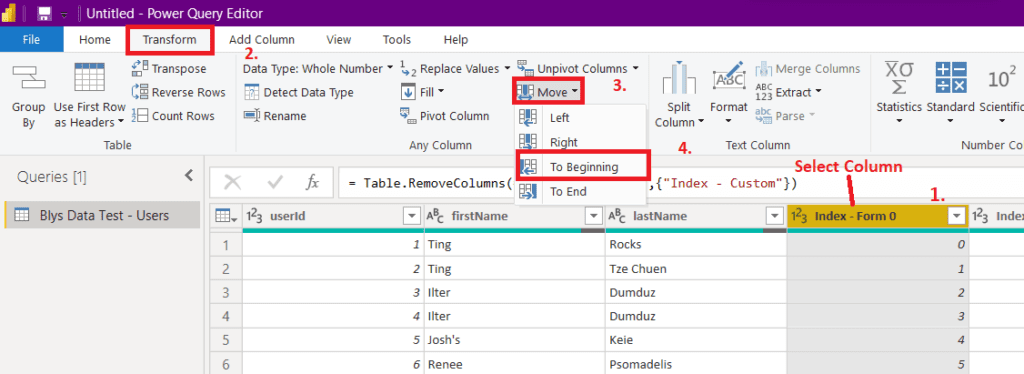
How can I add a newly constructed Index column at the start?
Choose To Begin from the menu after selecting the column, then click the Transform tab and Move icon.
Also, you may pick several columns and move them together using Ctrl + Click.
As you can see, business intelligence has a lot to offer businesses of all sizes across all industries. If you’re not already using BI in your decision-making process, now is the time to start!
For more customizable options, feel free to reach out to our Power BI Consulting Firm and explore tailored solutions to meet your specific needs.
Check out other helpful Power BI Blogs

If you are looking forward to getting your data pipeline built and setting up the dashboard for business intelligence, book a call now from here.
#analytics #data #business #artificialintelligence #machinelearning #startup #deeplearning #deeplearning #datascience #ai #growth #dataanalytics #india #datascientist #powerbi #dataanalysis #businessanalytics #businessanalyst #businessandmanagement #dataanalyst #businessanalysis #analyst #analysis #powerbideveloper #powerbidesktop #letsviz
Need a Power BI consultant for your team?
We've built Power BI dashboards and data automation for 100+ clients across finance, sales, operations, and executive reporting. Fixed-fee MVPs, first production dashboard in 3–4 weeks.
- Finance BI — P&L, balance sheet, budget vs actual, cash forecast
- Sales BI — CRM data cleaned, pipeline and forecast dashboards leadership trusts
- Operations BI — real-time KPIs with validation and alerting built in
- Embedded Power BI inside SaaS products with row-level security
See the Fortivis case study for a real example: an Athens-based financial advisory firm that replaced their multi-day manual reporting cycle with a validated Power BI pipeline.