Buttons to swap sheets using Parameters
We have filters and parameters to switch the values in the sheet and we can have value as we have selected the parameters or the filters. But in the dashboard suppose we want to have the swap the sheets on the basis of the parameter selected then what are the steps through which we can achieve that.
To use toggle buttons in the dashboard can have more fun to in other words we can make the dashboard more interactive and interesting for the user. To make this toggle experience we have a term called ‘button swapping’ which indicates the sheet will be swapped on the button selected.
In this session, we will learn to have a button swapping using a parameter in the sheet. It is a very easy process yet interesting. We have different methods for having button swapping but here we will discuss about how we can do it using a parameter.
Let’s have a example to create a discuss about the steps that can be followed,
For Example: – Create visualization where we use toggle buttons of sales and profit for swapping the sheets of sales per region and the profit per region.
- Firstly , we will be creating “Sales per State” for which from the data panel we will drag Country and state to the Details in the mark card .
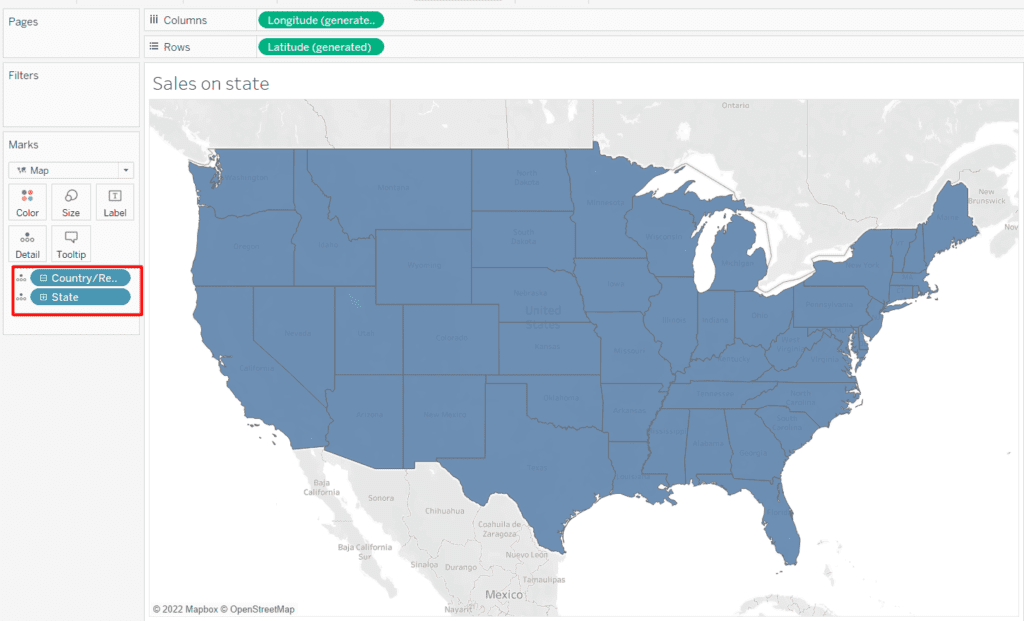
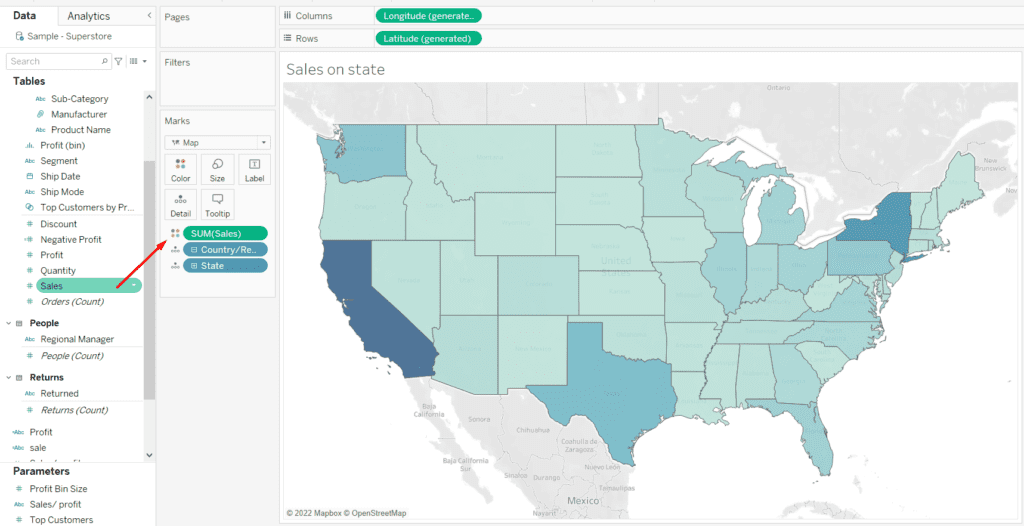
- Next we have to distinct the states using the SUM(sales) . Add the measure to the color legend in the mark label so we can see the sales on each state.
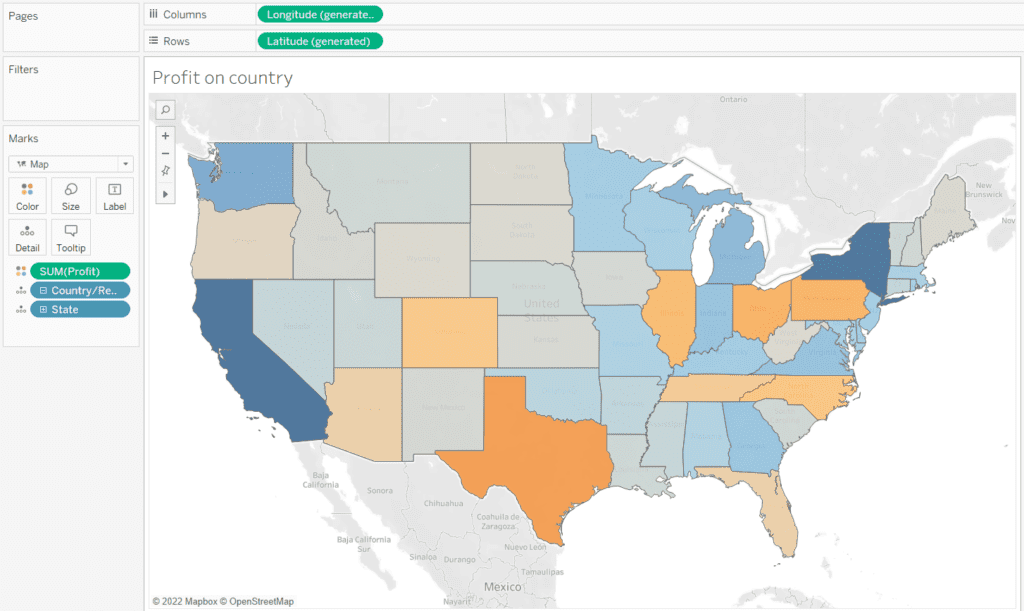
- We will replicate the same procedure for creating “Profit per State” so we will drag the Country and state to the Details in the mark card and will do all the procedure same.
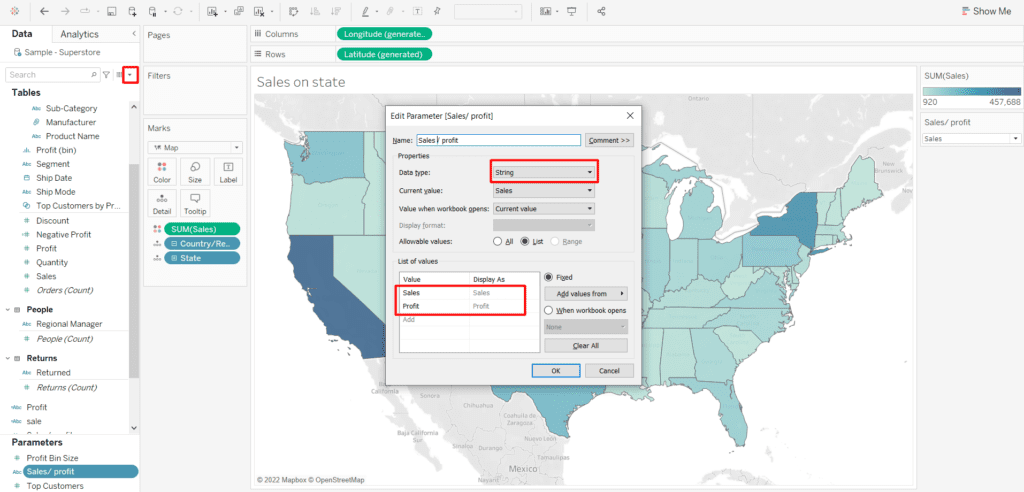
- Now after we have both our charts ready we have to create the Parameter where we have to mention the sales/ profit . So basically we will be using this parameter as when when we want the Sales then swap for sales sheet and vice versa for profit. To create the parameter we will click on the drop down on the data panel. When creating the parameter the should be on String as shown in the image because we want string value to toggle.
- Next we have to create a calculated field that would have created parameter in it to use it as a filter for the sheets.
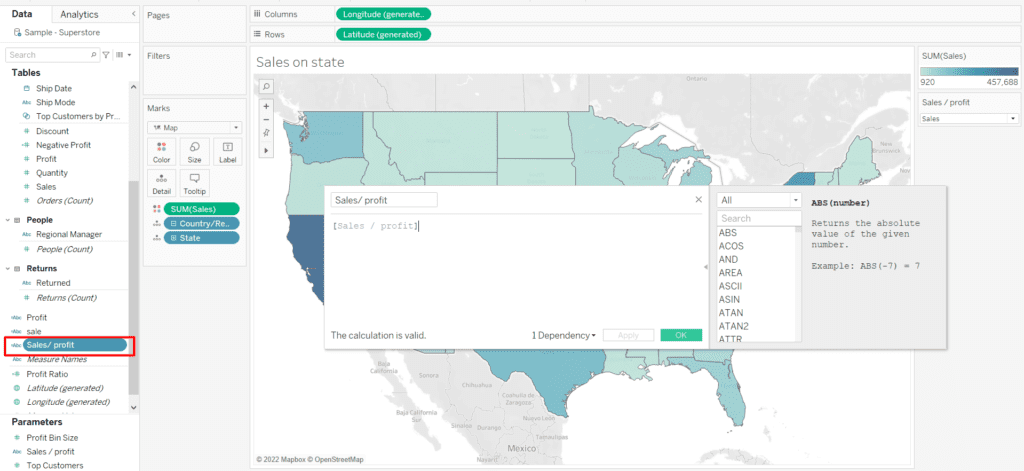
- Now for next step , we will drag the created calculated field “Sales / Profit” to the filter card and for Sales the filter will be selected as Sales and vice versa for profit.
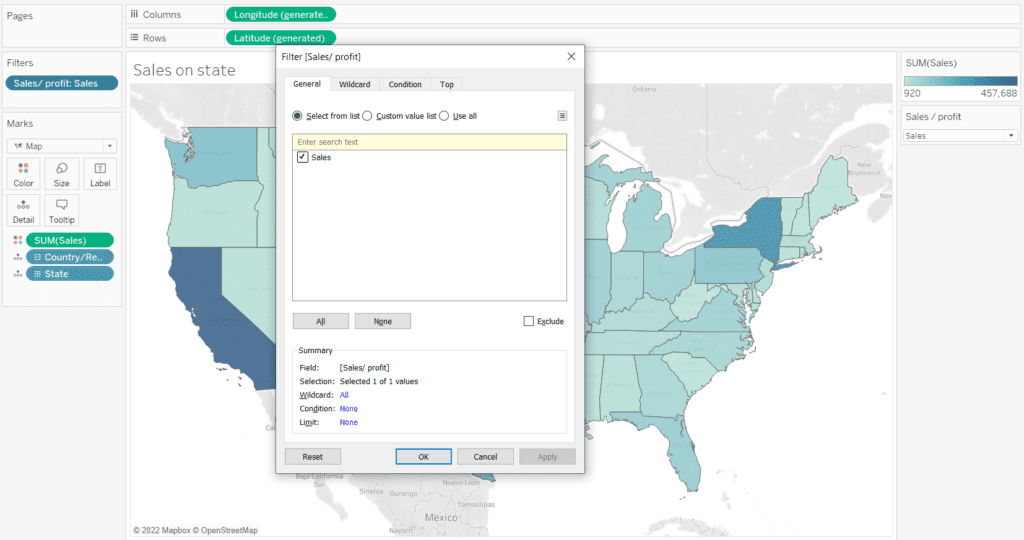
NOTE:- The filter that would be applied on “Sales on State” and “Profit on State” sheet in such manner as if considering “Sales on State” Sheet if we change the parameter from Sales to Profit then the sheet would disappear and same for PROFIT Sheet.
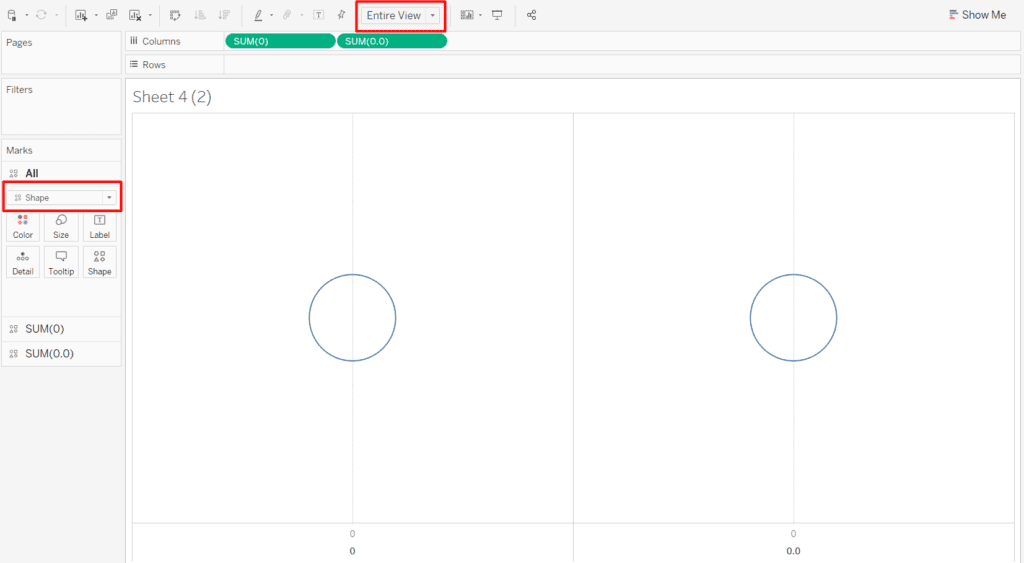
- Now Create a next sheet and name it as Toggle button and add SUM(0) AND SUM(0.0) respectively to the columns. Change the mark type to shapes. Make the view from STANDARD To ENTIRE view.
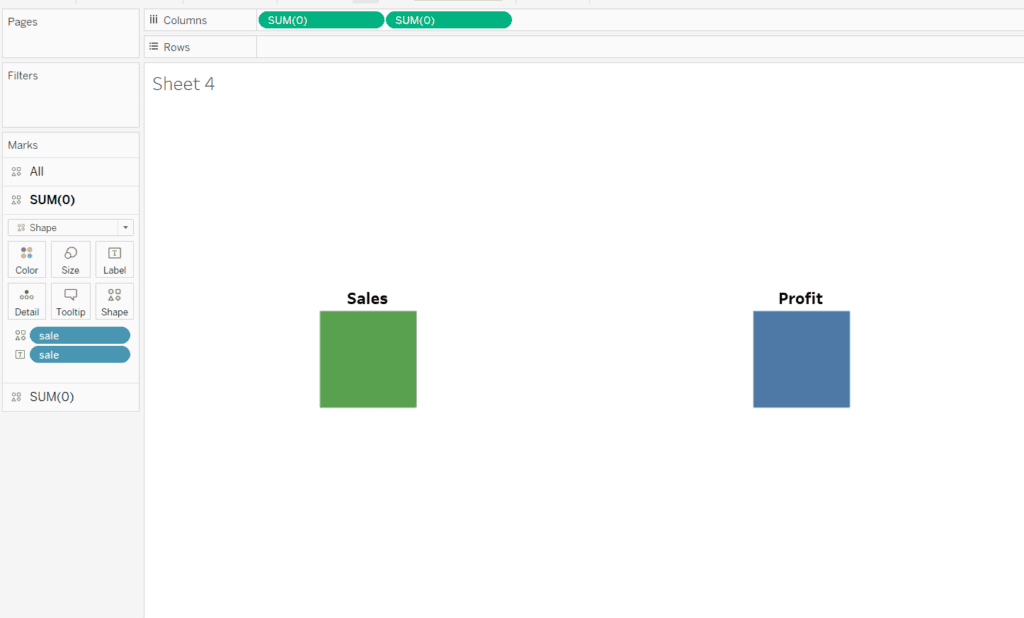
- Now for finish touches have different shapes on both the measure and label the buttons as Sales and profit . Also have different colors for each of them.
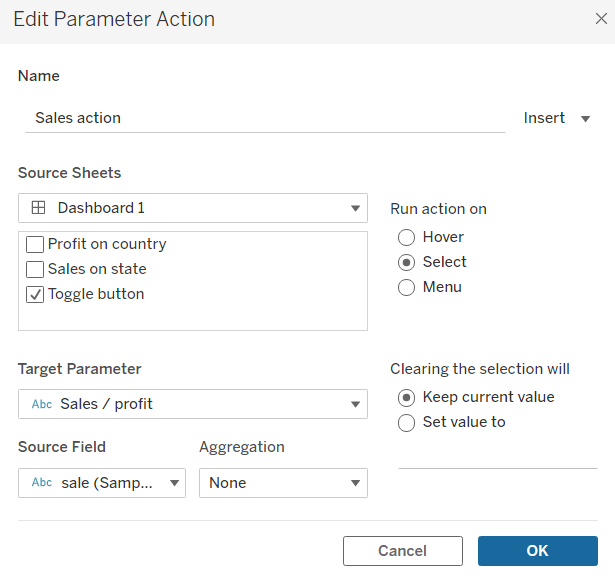
- Now Will arrange all the sheets to the dashboard properly and add action for both parameter value . Each case here represents each action . For adding action Go to dashboard -> Actions -> Change parameter
Case 1 : -For Sales Toggle Button
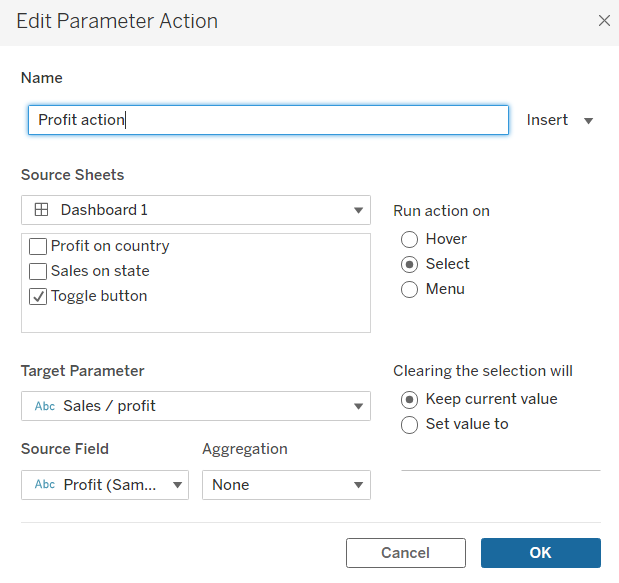
Case 2: – For Profit Toggle Button
- Now let’s check the result applying the Toggles to the dashboard.
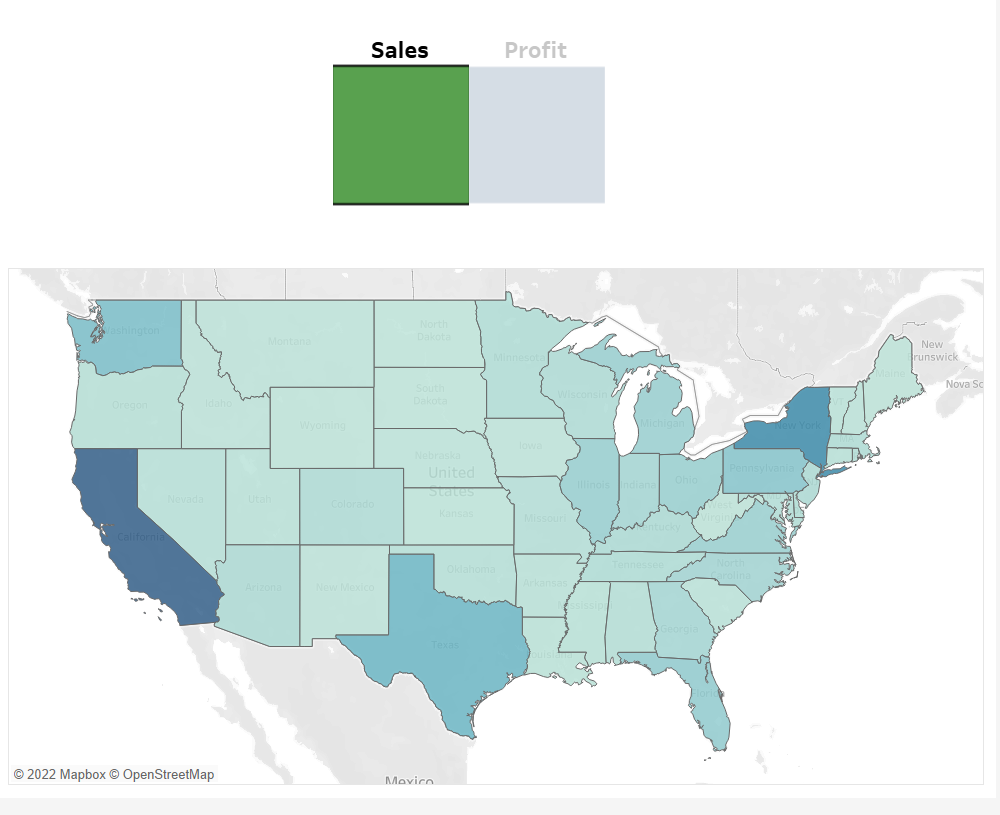
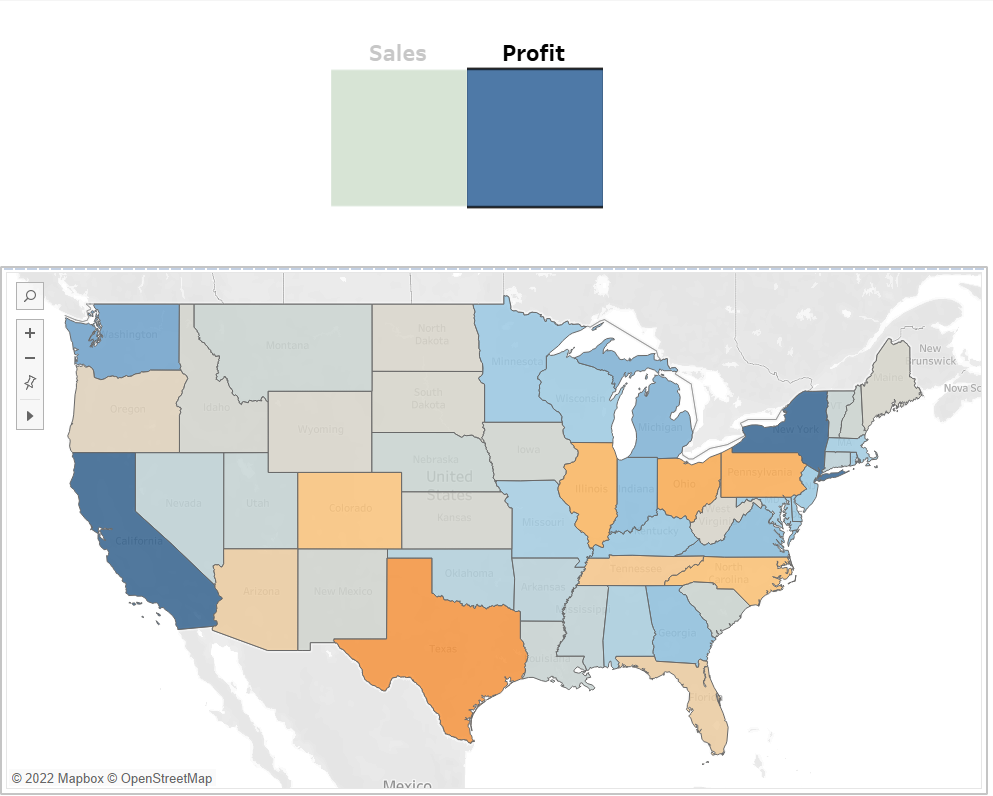
Pressing each buttons we get “Profit per region” and “Sales per region” . When one button is pressed then other sheet gets disappeared .In this case when Sales Button is pressed “Profit per region” sheet get disappeared and same for Profit Button.
Hoping that this blog helped the viewers in understanding how we can Toggle button to swap sheets using parameters and actions.
We hope you enjoy trying this out!
Some other tableau blogs to check out:
- How to create a rounded bar chart in Tableau
- How to create a donut chart in Tableau
- Edit Table calculation in Tableau
- Switch Between YoY and MoM using Parameter Selection
- Create and synchronize dual axis in Tableau
Follow us on Twitter, Facebook, Linkedin, and Tableau Public to stay updated with our latest blog and what’s new in Tableau.