What is a Financial Dashboard?
A financial dashboard is a smart, user-friendly tool that brings together all your critical financial data in one place. Think of it as your financial control center, giving you a clear, real-time snapshot of your organization’s financial health. It simplifies complex numbers into easy-to-understand visuals like charts, graphs, and widgets. With a financial dashboard, you can track key performance indicators (KPIs) such as expenses, sales, and profits, empowering you to make better decisions without getting bogged down in spreadsheets or raw data. Essentially, it’s your go-to resource for managing your finances efficiently and staying on top of what really matters.
How Can Financial Dashboards Help Us Make Better Business Decisions?
Financial dashboards are more than just tools for displaying data—they’re your secret weapon for making smarter, faster decisions. By leveraging these dashboards, you can transform raw financial data into meaningful insights that drive your business forward. Here’s how they help us:
Real-Time Data Access
Gone are the days of manually sifting through spreadsheets. A financial dashboard gives you up-to-the-minute data, all in one place. This means you can:
- Quickly spot trends and unusual patterns as they happen.
- Address potential problems before they escalate.
- Make confident, informed decisions that have a direct impact on your bottom line.
For example, tracking live revenue and expenses allows you to adapt strategies instantly, whether it’s doubling down on a winning campaign or cutting losses in underperforming areas.
Performance Monitoring
Keeping tabs on how well your business is performing is crucial, and a financial dashboard makes it effortless. You can monitor essential metrics like:
- Revenue Growth: See how your income is growing and identify what’s driving that growth—or holding it back.
- Expense Management: Stay on top of spending to make sure it aligns with your budget and goals.
- Profitability and Cash Flow: Understand how well your business generates profit and ensures liquidity.
This complete overview helps you identify areas where you’re excelling and pinpoint challenges that need immediate attention, ensuring your business stays on track.
Trend Identification
Looking at past data can reveal patterns that help you prepare for what’s ahead. Financial dashboards allow us to analyze historical trends and make data-driven predictions. With this insight, you can:
- Spot recurring seasonal trends or potential issues before they become major problems.
- Forecast future performance based on past results.
- Develop proactive strategies to stay ahead of challenges.
For instance, if your dashboard shows that profit margins have been shrinking over time, you can investigate the causes and take corrective action.
Goal Tracking
Every business sets financial goals, but tracking progress toward them can be tricky without the right tools. Financial dashboards simplify this process by letting you:
- Compare current performance with your targets.
- Pinpoint gaps in real-time and make adjustments on the fly.
- Stay accountable to goals like increasing revenue, reducing costs, or hitting profitability benchmarks.
Let’s say you’ve set a target to reduce operating costs by 15% this year. Your dashboard can provide weekly updates, showing exactly where you’re saving money and where you need to refocus efforts.
Why We Need Financial Dashboards
In today’s fast-paced business environment, having quick access to actionable financial insights isn’t just a nice-to-have—it’s a necessity. A financial dashboard helps you simplify complex data, monitor your organization’s performance, and make better, faster decisions. Whether you’re setting goals, identifying trends, or staying on top of your expenses, a financial dashboard keeps you informed, in control, and ready to tackle any financial challenge. It’s the key to staying ahead and achieving long-term success.
Checkout Our Insightful Financial Dashboard Examples
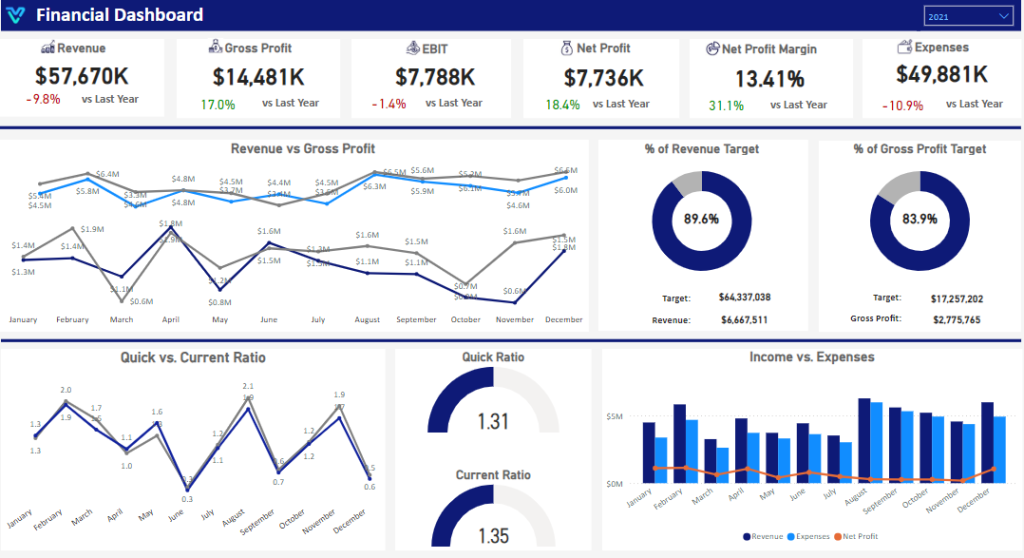
Financial Analysis Dashboard
Experience financial clarity with our captivating Power BI Finance Dashboard. Visualize key metrics, track performance trends, and make data-driven decisions effortlessly. From monitoring expenses to optimizing investments, our dashboard empowers you to drive financial success with ease
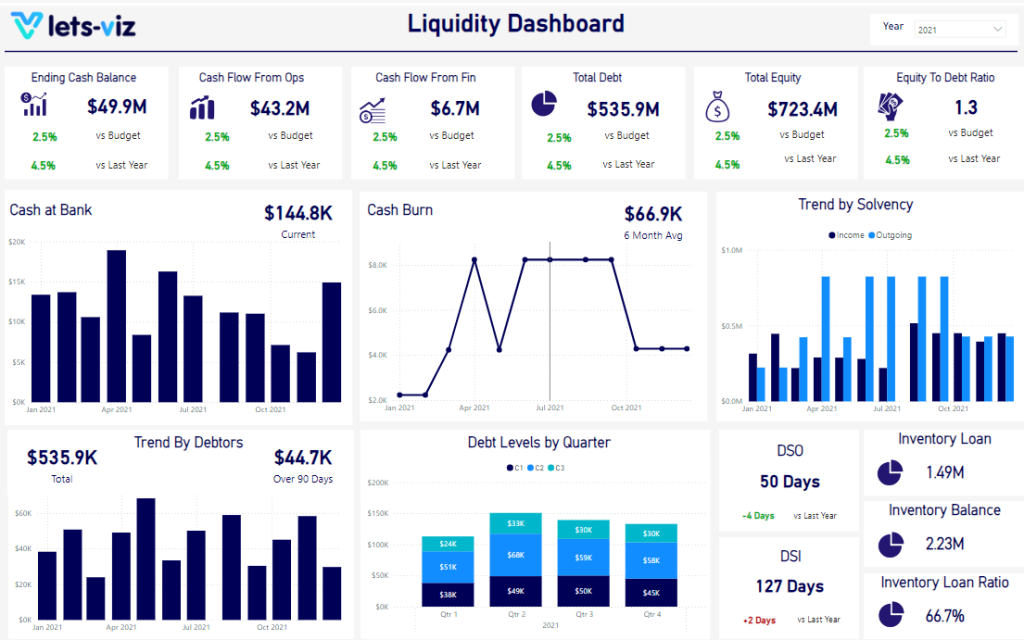
Financial Liquidity Dashboard
Maximize financial performance with our Power BI Liquidity Finance Dashboard. Monitor ending cash balance, analyze cash flow dynamics, manage total debt, and evaluate equity-to-debt ratio. Optimize liquidity management strategies and fuel sustainable growth.
Frequently Asked Questions :
A financial dashboard gives us real-time updates, easy-to-read visuals like charts and graphs, and tracks important metrics like revenue, expenses, and cash flow. It helps you stay on top of what matters most.
Unlike static reports, a financial dashboard updates in real-time and gives you an interactive view of your data. You can quickly spot trends and make decisions without waiting for the next report.
Yes, absolutely! Whether you’re managing cash flow or cutting costs, dashboards give us the clarity we need to make smarter decisions, even for smaller teams.
It depends on your goals, but you might want to track things like revenue growth, expenses, cash flow, or profit margins. For example, if cutting costs is your goal, keeping an eye on operating expenses can help.
Not at all! Most tools are user-friendly, with pre-built templates and integrations that make setup quick and easy for you.
Dashboards let us analyze past data and spot trends so we can plan better. For example, if you see seasonal patterns in sales, you can adjust inventory or marketing strategies ahead of time.
Check out other helpful Power BI Blogs
- What are the different types of Data Analysis?
- Choosing the Right BI tool – Follow these major guidelines
- Power BI Advantages Over Tableau
- Zoho Analytics vs Power BI: Which One is right for you?
- How to Format a Power BI visualization
- The Ultimate Guide to Tableau Business Dashboards: Templates, Key KPIs, and Examples
- How to build Dynamic X and Y Axis in Power BI Using Parameters?

If you are looking forward to getting your data pipeline built and setting up the dashboard for business intelligence, book a call now from here.