In today’s data-driven landscape, Power BI business dashboards have become an indispensable tool for decision-makers. Whether you’re a CEO, tech leader, or marketing head, having actionable insights at your fingertips can drive success.
This guide explores Power BI dashboard templates, key performance indicators (KPIs), and real-world examples to help you design dashboards that deliver clarity and drive strategic decisions. Plus, access a free Power BI business dashboard template to kickstart your journey.
What Are Power BI Business Dashboards?
Power BI business dashboards are visual tools designed to display complex data in an intuitive, interactive format. They consolidate key metrics and KPIs, allowing leaders to monitor performance, identify trends, and make data-driven decisions in real-time.
For example, a Power BI customer dashboard can help track customer satisfaction, churn rates, and lifetime value, providing actionable insights for improving retention strategies.
Advantages of Power BI Business Dashboards
Why should decision-makers adopt Power BI dashboards? Here are some of the key benefits:
1. Unified Insights:
Power BI dashboards integrate diverse data points into a single, streamlined view, eliminating the need to toggle between different tools or reports.
2. Real-Time Data Updates
By connecting to live data sources, these dashboards deliver instant updates, allowing decisions to be made quickly based on the most current metrics.
3. Tailored Visualizations
No two businesses are the same. Power BI offers extensive customization options to align dashboards with your unique objectives and branding.
4. Seamless Scalability
As your business expands, Power BI dashboards grow with you, easily managing increased data volumes and additional users.
5. Enhanced Collaboration
Dashboards can be shared across teams, promoting a data-driven culture and ensuring that all stakeholders have access to consistent insights.
Examples of Power BI Dashboards with Templates with Key KPIs for Business
Effective dashboards are built around Key Performance Indicators (KPIs) that align with strategic business objectives. Let’s explore some KPIs across various domains:
1. Financial Analysis Dashboard
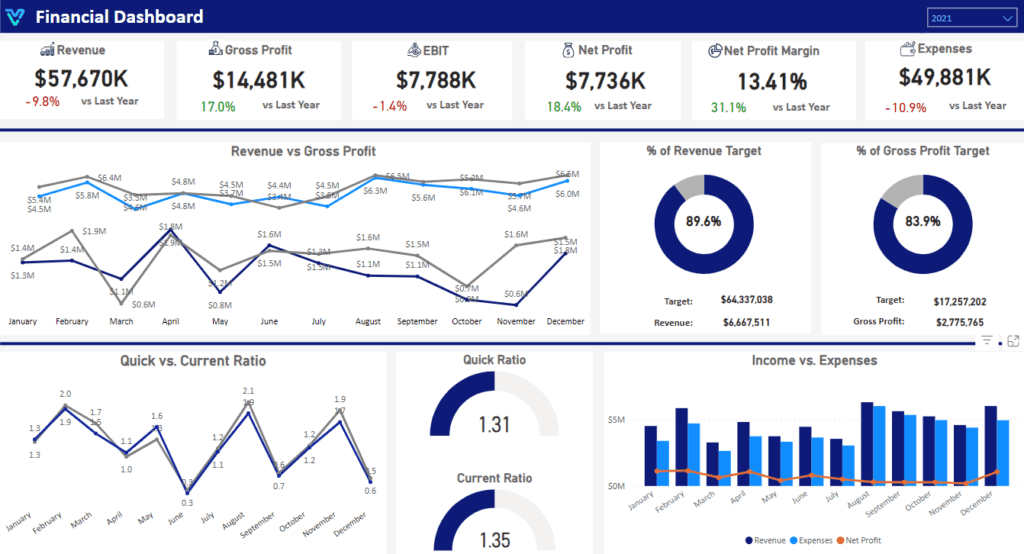
A Financial Analysis Dashboard provides a centralized view of key financial metrics, allowing business leaders to easily monitor revenue, expenses, and overall profitability. By integrating data from accounting systems, this dashboard offers drill-down capabilities to examine specific accounts or expense categories. Insights are visualized through tools like waterfall charts and trend lines, aiding in accurate forecasting.
Key Use Cases:
- Track cash flow.
- Compare actual expenses to budgeted amounts.
- Assess financial health over time.
Key KPIs:
Net Profit Margin: This tells us how much profit remains after covering all expenses. It’s a key indicator of how efficiently we’re running the business and how profitable it truly is.
Gross Profit Margin: This metric shows how well we’re generating profit from our core products or services before factoring in operational costs. It’s a great way to gauge the strength of our offerings.
Operating Expenses: Keeping track of operating expenses ensures that our daily spending aligns with the revenue we’re bringing in. It helps us stay on track and avoid unnecessary costs.
Budget Variance: By comparing our actual spending to the budget we planned, we can spot any gaps and adjust our strategies to stay on course. It’s all about being proactive and adaptable.
Accounts Receivable Turnover: This metric lets us see how quickly we’re collecting payments from customers. It’s crucial for keeping a healthy cash flow and ensuring we have the resources we need to grow.
Explore more: Financial Dashboard Templates
2. Financial Liquidity Dashboard
A Financial Liquidity Dashboard provides a consolidated view of key liquidity metrics, enabling business leaders to effectively monitor cash flow and ensure the organization’s ability to meet short-term obligations. By integrating data from financial systems, this dashboard allows for in-depth analysis of specific accounts, liabilities, or receivables. Visualizations such as bar charts and trend lines offer clear insights to support liquidity management and planning.
Key Use Cases:
- Track cash flow availability.
- Assess the organization’s capacity to meet financial obligations.
- Analyze changes in liquidity and working capital over time.
Key KPIs:
Current Ratio: This helps us evaluate how well we can cover short-term liabilities using our current assets. It provides a quick snapshot of our financial health and liquidity.
Quick Ratio: By excluding inventory, the quick ratio gives us a more focused view of our ability to meet immediate obligations. It’s a sharper measure of liquidity that can guide short-term decision-making.
Cash Conversion Cycle (CCC): The CCC tracks how long it takes us to turn investments in inventory and receivables into cash. It’s a key indicator of how efficiently we’re managing liquidity and cash flow.
Accounts Payable Turnover: This metric shows how quickly we’re paying off short-term debts. It’s a reflection of our financial discipline and our ability to maintain good relationships with vendors.
Days Cash on Hand: This tells us how many days we can keep operations running with our available cash reserves. It’s a critical measure of preparedness for unexpected challenges and maintaining business continuity.

Explore more: Financial Liquidity Dashboard
3. Sales Performance Dashboard
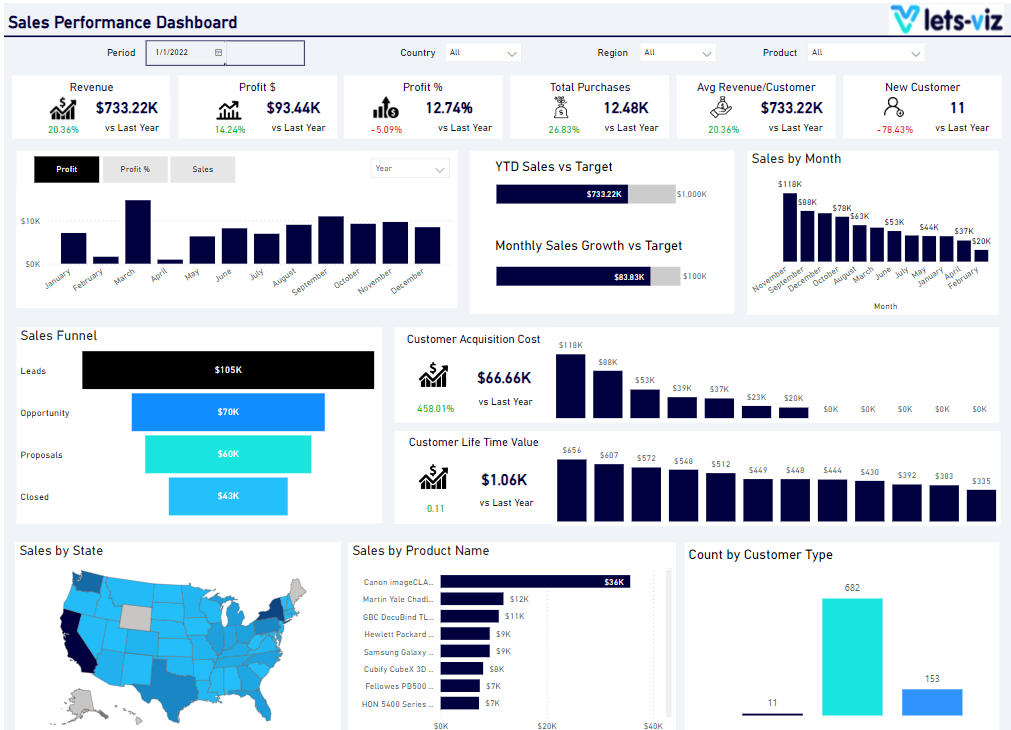
A sales performance dashboard provides a comprehensive view of key sales metrics, enabling business leaders to monitor revenue, sales trends, and team performance. By integrating data from CRM or sales platforms, this dashboard offers drill-down capabilities to analyze specific regions, products, or sales representatives. Visual tools like bar charts and trend lines present actionable insights, aiding in strategic planning and goal tracking.
Key Use Cases:
- Track sales revenue and growth.
- Compare actual sales to targets or forecasts.
- Assess team and product performance over time.
Key KPIs:
Sales Growth Rate: This metric shows us the percentage increase in sales over a specific period, giving us a clear view of our overall business growth.
Sales Target Achievement: By comparing actual sales to our predefined goals, we can track how well we’re performing as a team and whether we’re meeting our sales objectives.
Average Deal Size: This tells us the average revenue generated per sale, helping us assess the effectiveness of our sales strategies and identify areas for improvement.
Lead Conversion Rate: This measures the percentage of leads we successfully turn into customers, providing valuable insights into our sales efficiency and process effectiveness.
Sales Cycle Length: The average time it takes us to close a deal is captured here, giving us a better understanding of our sales process efficiency and where we can streamline operations.
Explore more: Sales Performance Dashboard
4. Logistics Dashboard
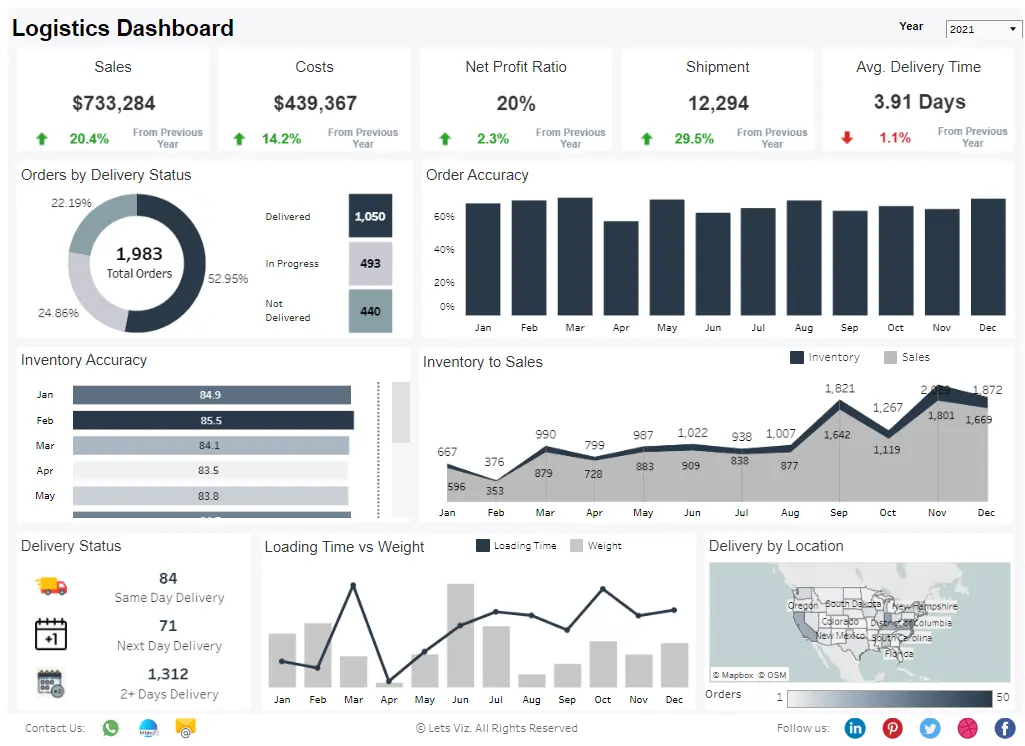
A Logistics Dashboard provides a unified view of critical logistics metrics, enabling business leaders to efficiently monitor supply chain performance, delivery timelines, and operational efficiency. By integrating data from logistics systems, this dashboard allows for detailed analysis of specific routes, shipments, or warehouse activities. Insights are presented using visual tools like bar charts and line graphs, supporting better decision-making and operational planning.
Key Use Cases:
- Monitor delivery timelines.
- Compare planned vs. actual shipping costs.
- Evaluate overall supply chain efficiency.
Key KPIs:
On-Time Delivery Rate: This metric helps us track the percentage of shipments delivered on or before the scheduled time, showing how reliable our operations are in meeting deadlines.
Transportation Costs: By monitoring our shipping and logistics expenses, we can pinpoint areas where we might optimize costs and improve our efficiency.
Order Accuracy: This measures the percentage of orders we fulfill without errors, ensuring customer satisfaction and minimizing returns by maintaining a high standard of accuracy.
Warehouse Utilization: We evaluate how efficiently we’re using warehouse space, helping us manage inventory better and optimize storage resources.
Shipping Lead Time: This tracks the average time it takes us to process and ship orders, giving us insight into any bottlenecks in our workflow that we can address for faster delivery.
Explore more: Logistics Dashboard Template
5. Hospital Performance Dashboard
A Hospital Performance dashboard provides a comprehensive view of critical healthcare metrics, enabling hospital administrators to monitor patient outcomes, operational efficiency, and resource utilization. By integrating data from hospital management systems, this dashboard allows for in-depth analysis of specific departments, services, or patient categories. Visual tools like bar graphs and trend lines present actionable insights to enhance decision-making and improve patient care.
Key Use Cases:
- Monitor patient flow and bed occupancy.
- Compare actual healthcare costs to budgeted allocations.
- Evaluate overall hospital performance and efficiency over time.
Key KPIs:
Patient Satisfaction Rate: This measures the percentage of patients who report positive experiences with their care, giving us a clear reflection of the quality of care we provide.
Bed Occupancy Rate: By tracking the percentage of hospital beds in use, we can understand how efficiently our resources are being utilized and identify opportunities for improvement.
Average Length of Stay (ALOS): This metric helps us monitor the average duration of patient stays, allowing us to identify areas where we could streamline processes or improve care efficiency.
Readmission Rates: We track the frequency of patient readmissions within a specific time frame to evaluate the effectiveness of our treatments and ensure we’re delivering high-quality care.
Staff-to-Patient Ratio: By measuring the balance between healthcare staff and patients, we ensure that we have adequate resources in place to provide optimal care for every patient.
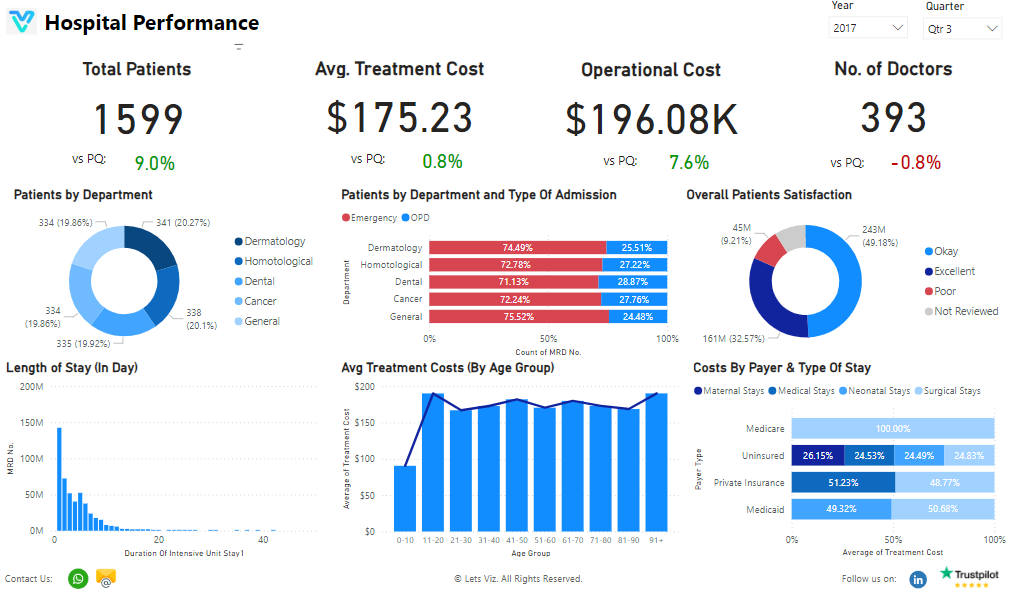
Explore more: Hospital Performance Dashboard Examples
6. Shopify Dashboard
A Shopify dashboard offers a centralized view of key e-commerce metrics, enabling business owners to efficiently track sales performance, customer behavior, and overall profitability. By integrating data from your Shopify store, this dashboard provides drill-down capabilities to analyze product categories, individual items, or marketing campaigns. Visual insights, such as bar charts and trend lines, support informed decision-making and strategic growth.
Key Use Cases:
- Monitor daily and monthly sales performance.
- Compare actual revenue to sales targets.
- Assess customer behavior and shopping trends over time.
Key KPIs:
Sales Growth Rate: This metric tracks the percentage increase or decrease in sales over time, giving us valuable insights into growth trends and opportunities for improvement.
Average Order Value (AOV): By measuring the average amount customers spend per order, we can better understand customer purchasing behavior and adjust our pricing strategies accordingly.
Customer Acquisition Cost (CAC): This calculates the cost of acquiring new customers, helping us ensure that our marketing expenses are in line with profitability and customer retention goals.
Cart Abandonment Rate: This identifies the percentage of customers who leave without completing their purchase. By understanding this, we can optimize the checkout process to improve conversions.
Inventory Turnover Ratio: We track how quickly products are sold and replaced, which helps us ensure effective inventory management and minimize excess stock.
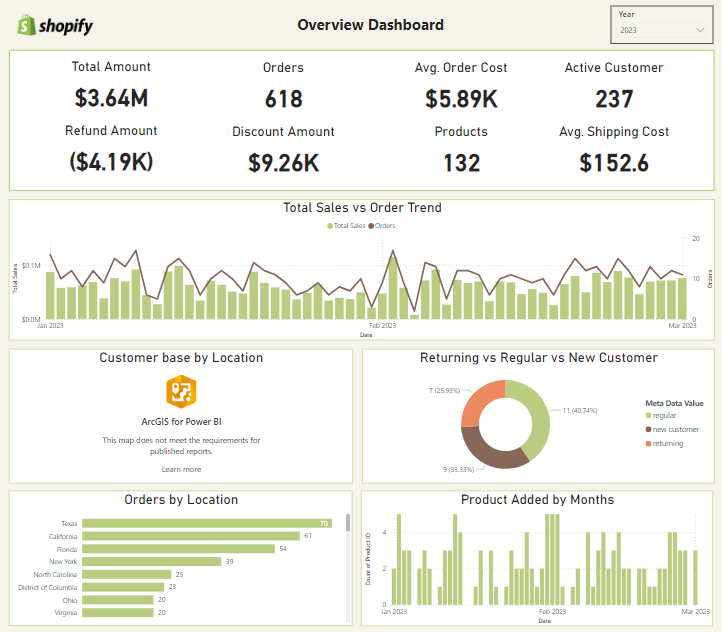
Explore more: Shopify Dashboard Template
7. Twitter Marketing Dashboard
A Twitter Marketing Dashboard provides a centralized view of critical engagement metrics, enabling marketers to efficiently track campaign performance, audience growth, and overall impact. By integrating data from Twitter analytics, this dashboard offers drill-down capabilities to analyze individual posts, hashtags, or ad campaigns. Visual insights, such as bar charts and line graphs, help optimize strategies and maximize audience reach.
Key Use Cases:
- Monitor audience engagement and follower growth.
- Compare campaign performance against set targets.
- Assess overall social media impact over time.
Key KPIs:
Engagement Rate: This tracks the percentage of interactions (likes, retweets, replies) relative to impressions, giving us a clear view of how effective our content is at engaging the audience.
Follower Growth: By measuring the increase or decrease in followers over time, we can understand how well our campaigns are performing and whether we’re expanding our audience.
Click-Through Rate (CTR): This helps us monitor the percentage of users who click on links in our posts, offering insights into how effective our call-to-action strategies are.
Hashtag Performance: By evaluating how specific hashtags are performing, we can better understand their reach and engagement, allowing us to refine our content strategy.
Tweet Frequency: This tracks the number of tweets we post, ensuring that we maintain consistency and stay in line with what our audience expects from us.
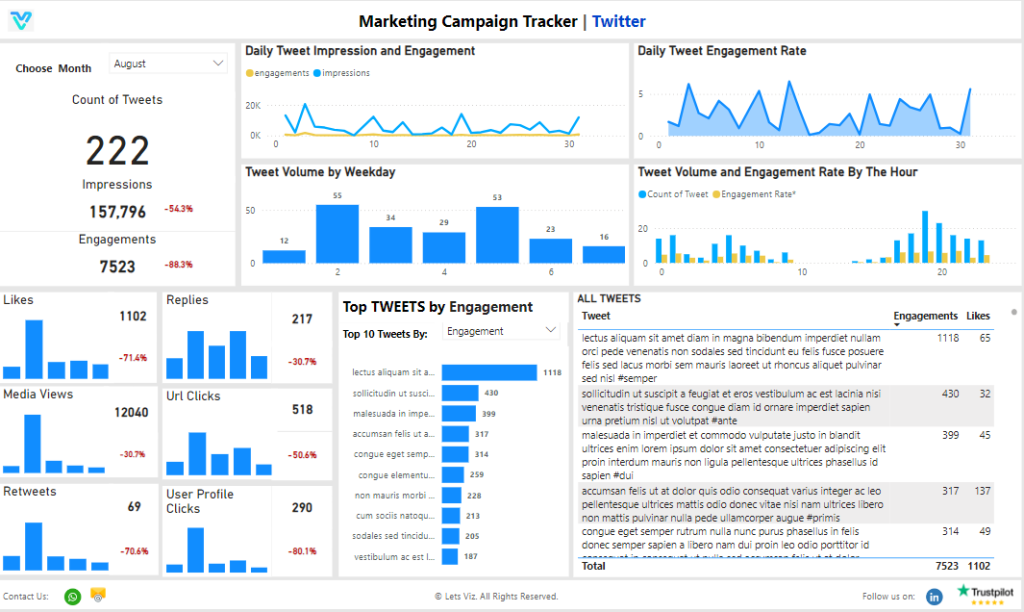
Explore more: Twitter Marketing Dashboard Template
8. LinkedIn Ads Performance Dashboard
A LinkedIn Ads Performance Dashboard provides a centralized view of key advertising metrics, enabling marketers to effectively track the success of campaigns, monitor ad spend, and measure overall return on investment (ROI). By integrating data from LinkedIn Campaign Manager, this dashboard offers drill-down capabilities to analyze specific ad campaigns, demographics, or content types. Insights are visualized through charts and graphs, aiding in decision-making and campaign optimization.
Key Use Cases:
- Monitor ad spend and budget utilization.
- Compare actual performance to campaign goals.
- Assess overall ad effectiveness over time.
Key KPIs:
Click-Through Rate (CTR): This measures the percentage of users who click on your ads, giving us insight into how compelling your ad copy and targeting strategies are.
Cost Per Click (CPC): By tracking how much we’re paying for each click, we can optimize your budget and improve the performance of your ads.
Conversion Rate: This evaluates how many users take the desired action after clicking on an ad, allowing us to assess the effectiveness of the landing page and the overall campaign.
Return on Ad Spend (ROAS): This metric helps us measure the revenue generated for every dollar spent on ads, providing a clear view of the return on investment (ROI) from your campaigns.
Impressions: We track the number of times your ad is shown to users, helping us assess the reach and visibility of your campaigns.
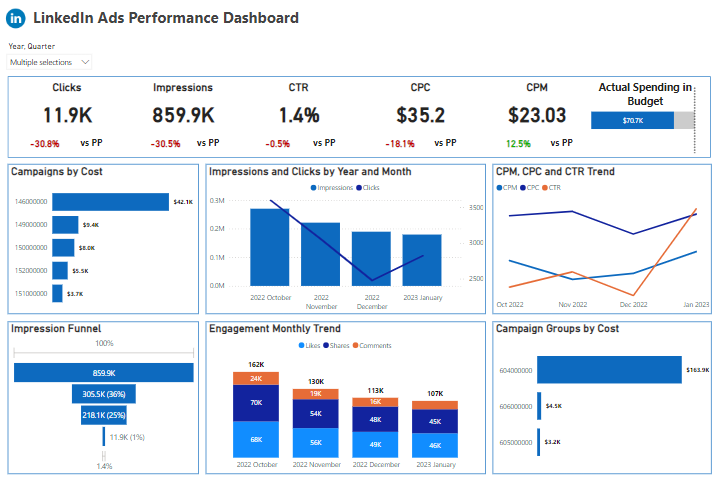
Explore more: LinkedIn Ads Performance Dashboard
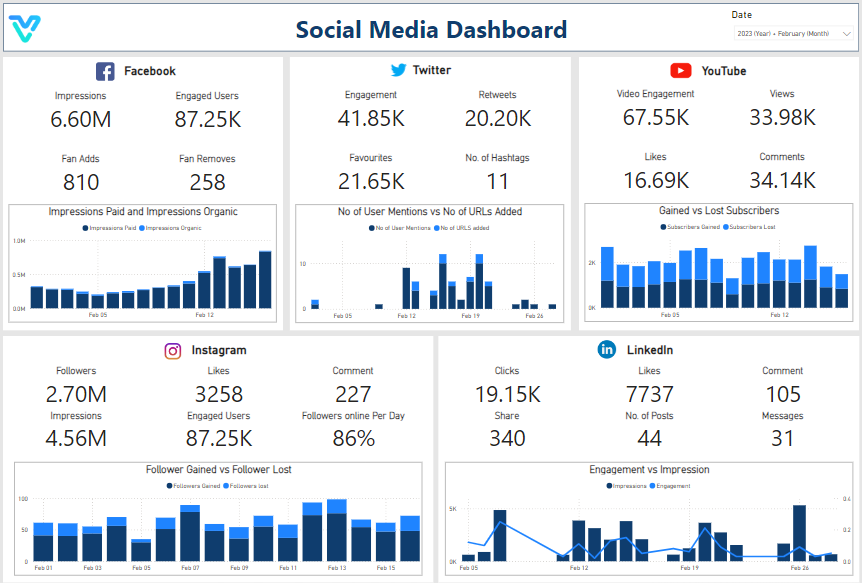
9. Combined Social Media Dashboard
A combined social media dashboard consolidates key social media metrics from multiple platforms, providing businesses with a comprehensive view of their online presence. This dashboard integrates data from networks like Facebook, Instagram, Twitter, and LinkedIn, offering detailed insights on engagement, reach, and campaign performance. Visualizations such as bar charts, pie charts, and trend lines help businesses track the effectiveness of their social media strategies and optimize future campaigns.
Key Use Cases:
- Monitor engagement and reach across various platforms.
- Compare performance metrics across different social media channels.
- Assess the impact of social media campaigns over time.
Key KPIs:
Engagement Rate: This reflects how effectively your content resonates with your audience. We measure it by looking at likes, shares, and comments relative to your total followers, giving us an understanding of content performance.
Follower Growth: We track the increase in your followers over time, helping us evaluate the effectiveness of your social media strategies and content in attracting new audience members.
Click-Through Rate (CTR): By monitoring the number of clicks your posts or ads generate, we can assess how compelling your content is and how well it encourages audience interaction.
Conversion Rate: This metric helps us evaluate the percentage of users who take a desired action after interacting with your post, such as making a purchase or signing up for your newsletter.
Impressions: We track how many times your content is displayed across social media channels. This gives us insight into its reach and visibility, helping you understand how far your message is spreading.
Explore more: Combined Social Media Dashboard
How to Design an Effective Power BI Dashboard
1. Define Your Goals
What do you want to achieve? Whether it’s boosting revenue, reducing costs, or improving customer satisfaction, defining goals is the first step.
2. Choose Relevant KPIs
Align KPIs with your goals and ensure they are measurable, actionable, and relevant.
3. Use Pre-Built Templates
Leverage Power BI dashboard templates for a quick start, customizing them to suit your specific needs.
4. Optimize for Usability
- Use clean, intuitive layouts.
- Incorporate filters and drill-down options for better interactivity.
- Regularly test performance to ensure responsiveness.