Tableau – Create a Dashboard
A dashboard is a collection of several worksheets & views in a single place which is used to compare and monitor a variety of data simultaneously. While creating it, add any worksheet along with other objects such as text areas, web pages, and images. For Example, if we need to know the daily report of sales of companies, so we will create a dashboard putting all the views which all areas are affecting the sales. Through this, we won’t need to hop on every sheet as per need. Creating them helps us to compare the variation in data.
Data in sheets and dashboards are always connected, so if we modify the sheets, the changes will be seen in the dashboards and the same for sheets. Both sheets and dashboards get updated with the data from the source.
Let’s see how can we create a simple dashboard. Follow the given steps (Using Sample Superstore )
Example – Using the Sample-superstore, create a dashboard showing the sales and profits for different Sub-categories distributed through Category.
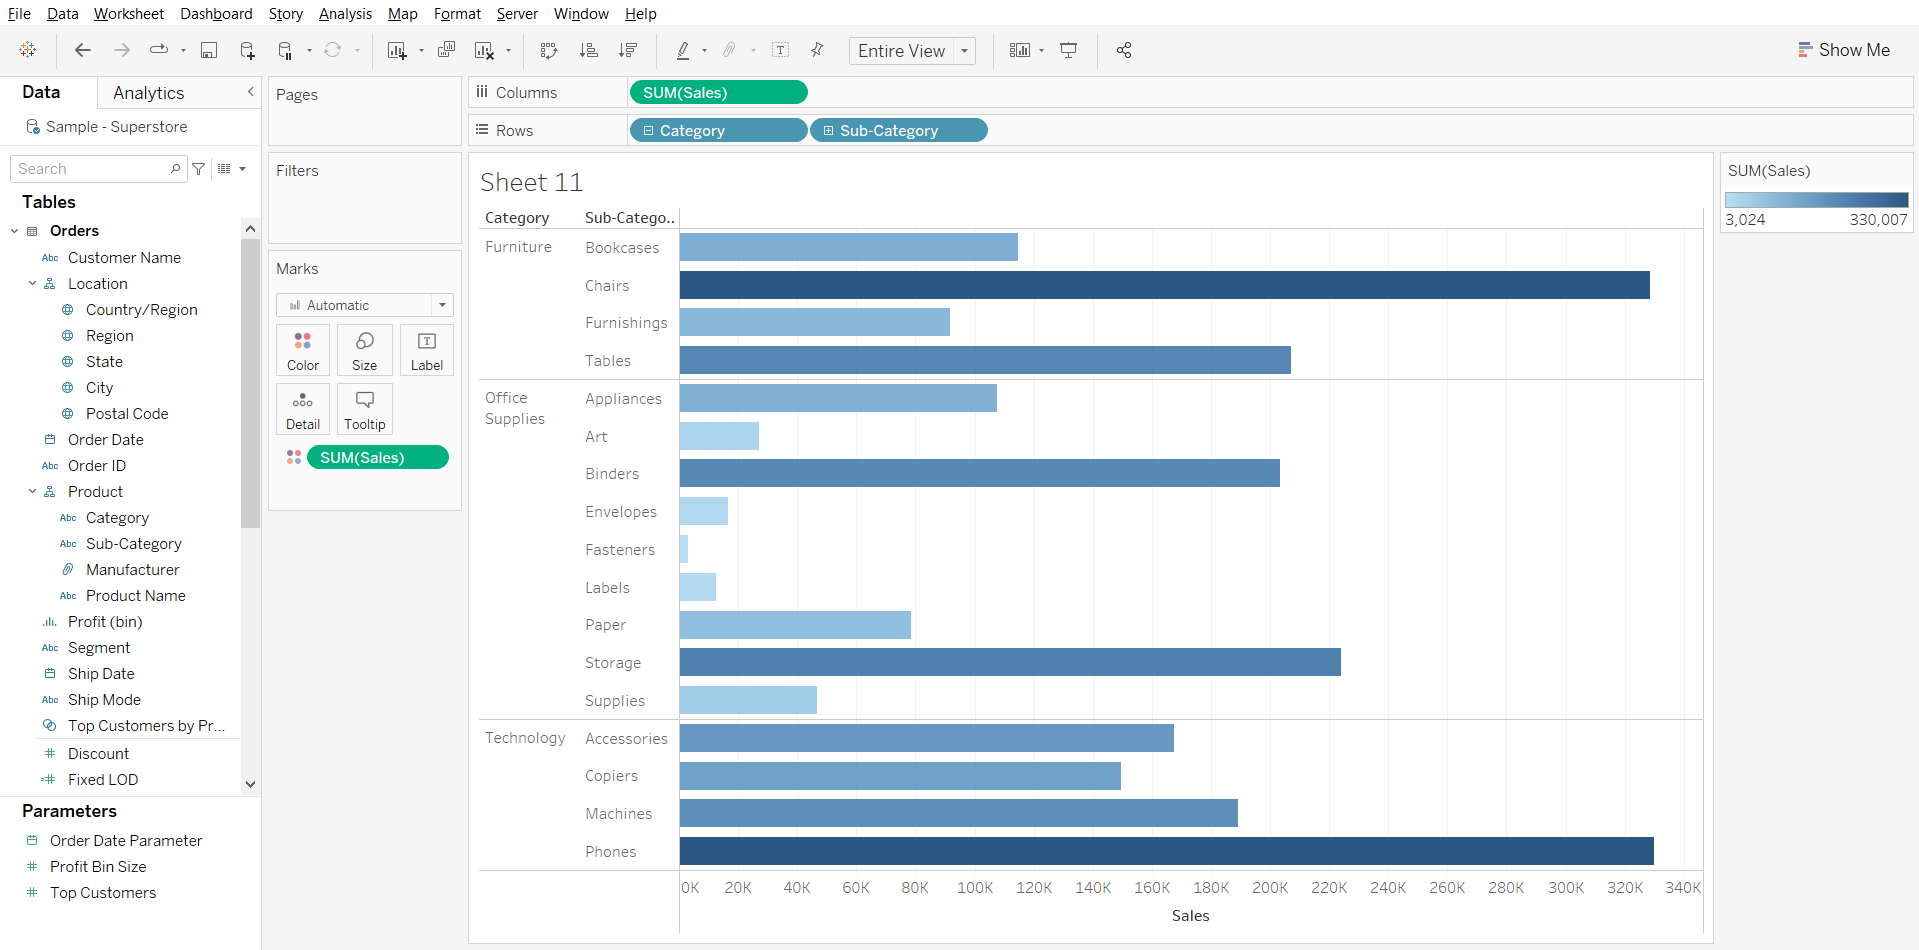
- Create a blank worksheet by clicking on Sheet1, next to the data source. Drag the Measure Sum(Sales) to the columns shelf and the dimension Sub-Category & Category to the Rows Shelf. Drag and drop the Measure Sum(Sales) to the Color shelf. Right-click and rename this worksheet as Sales_Sub-category.
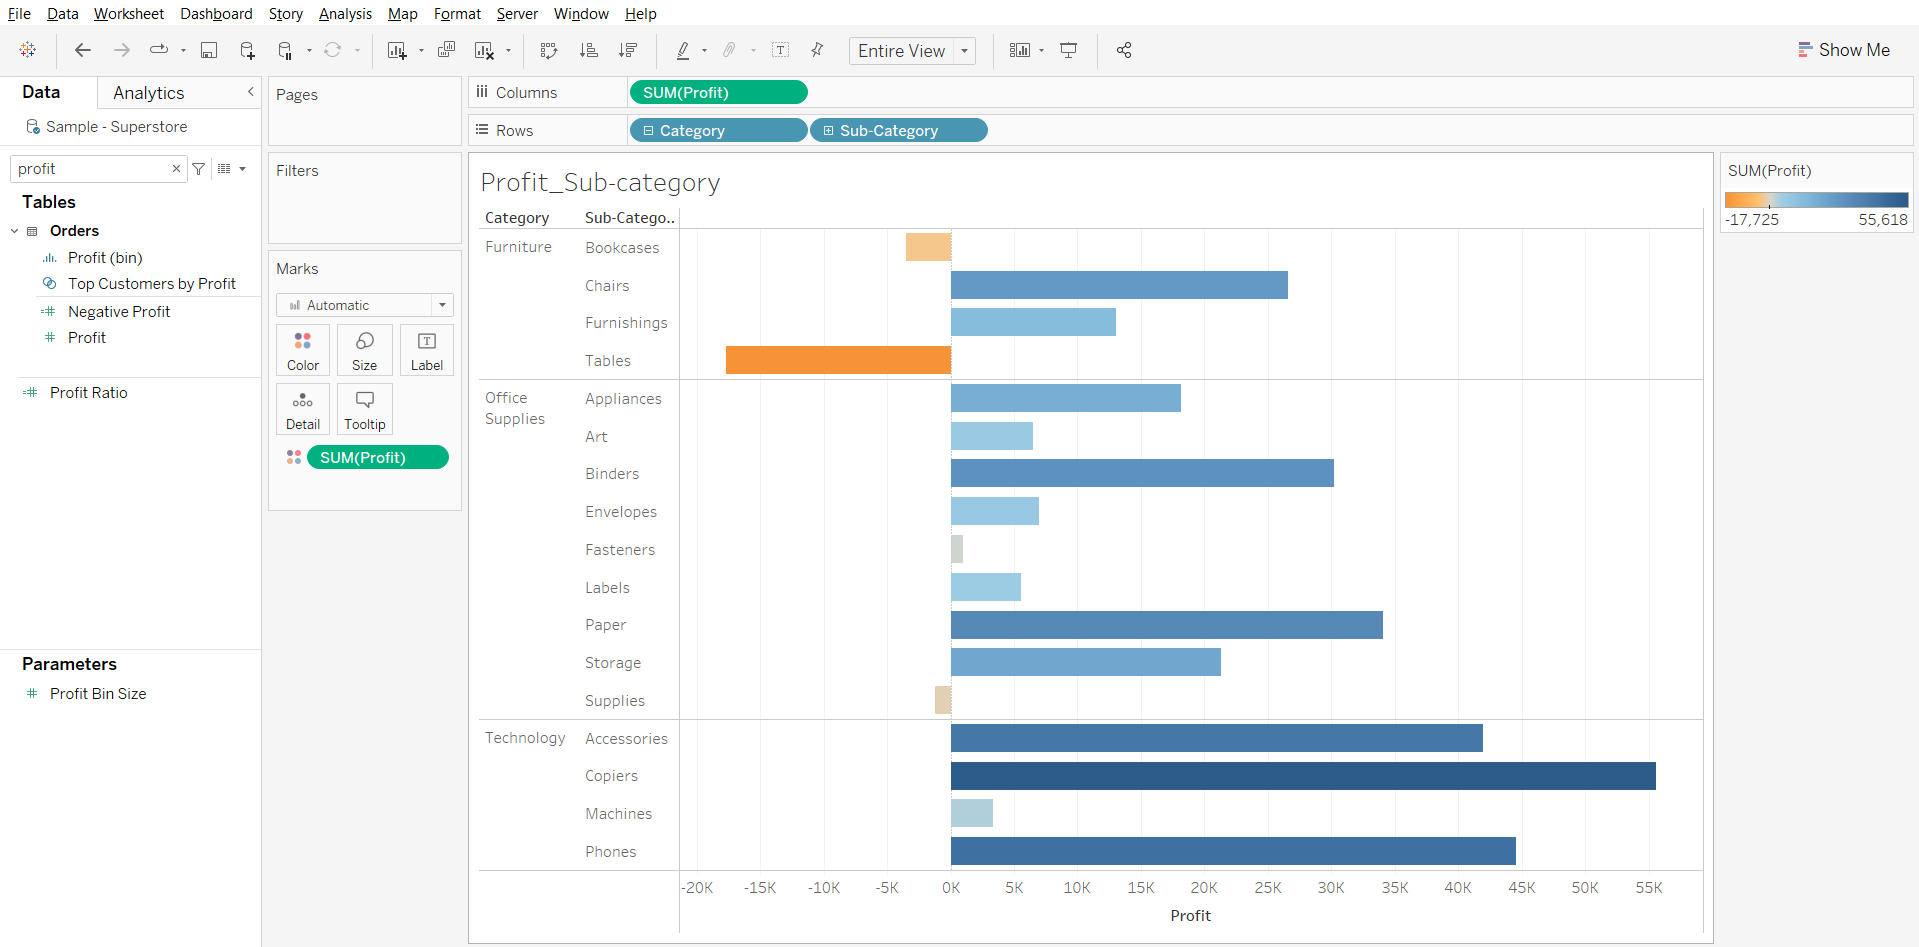
- Create another blank worksheet by clicking on Sheet12, next to the data source. Drag the Measure Sum(Profit) to the columns shelf and the dimension Sub-Category & Category to the Rows Shelf. Drag and drop the Measure Sum(Profit) to the Color shelf. Right-click and rename this worksheet as Profit_Sub-category.
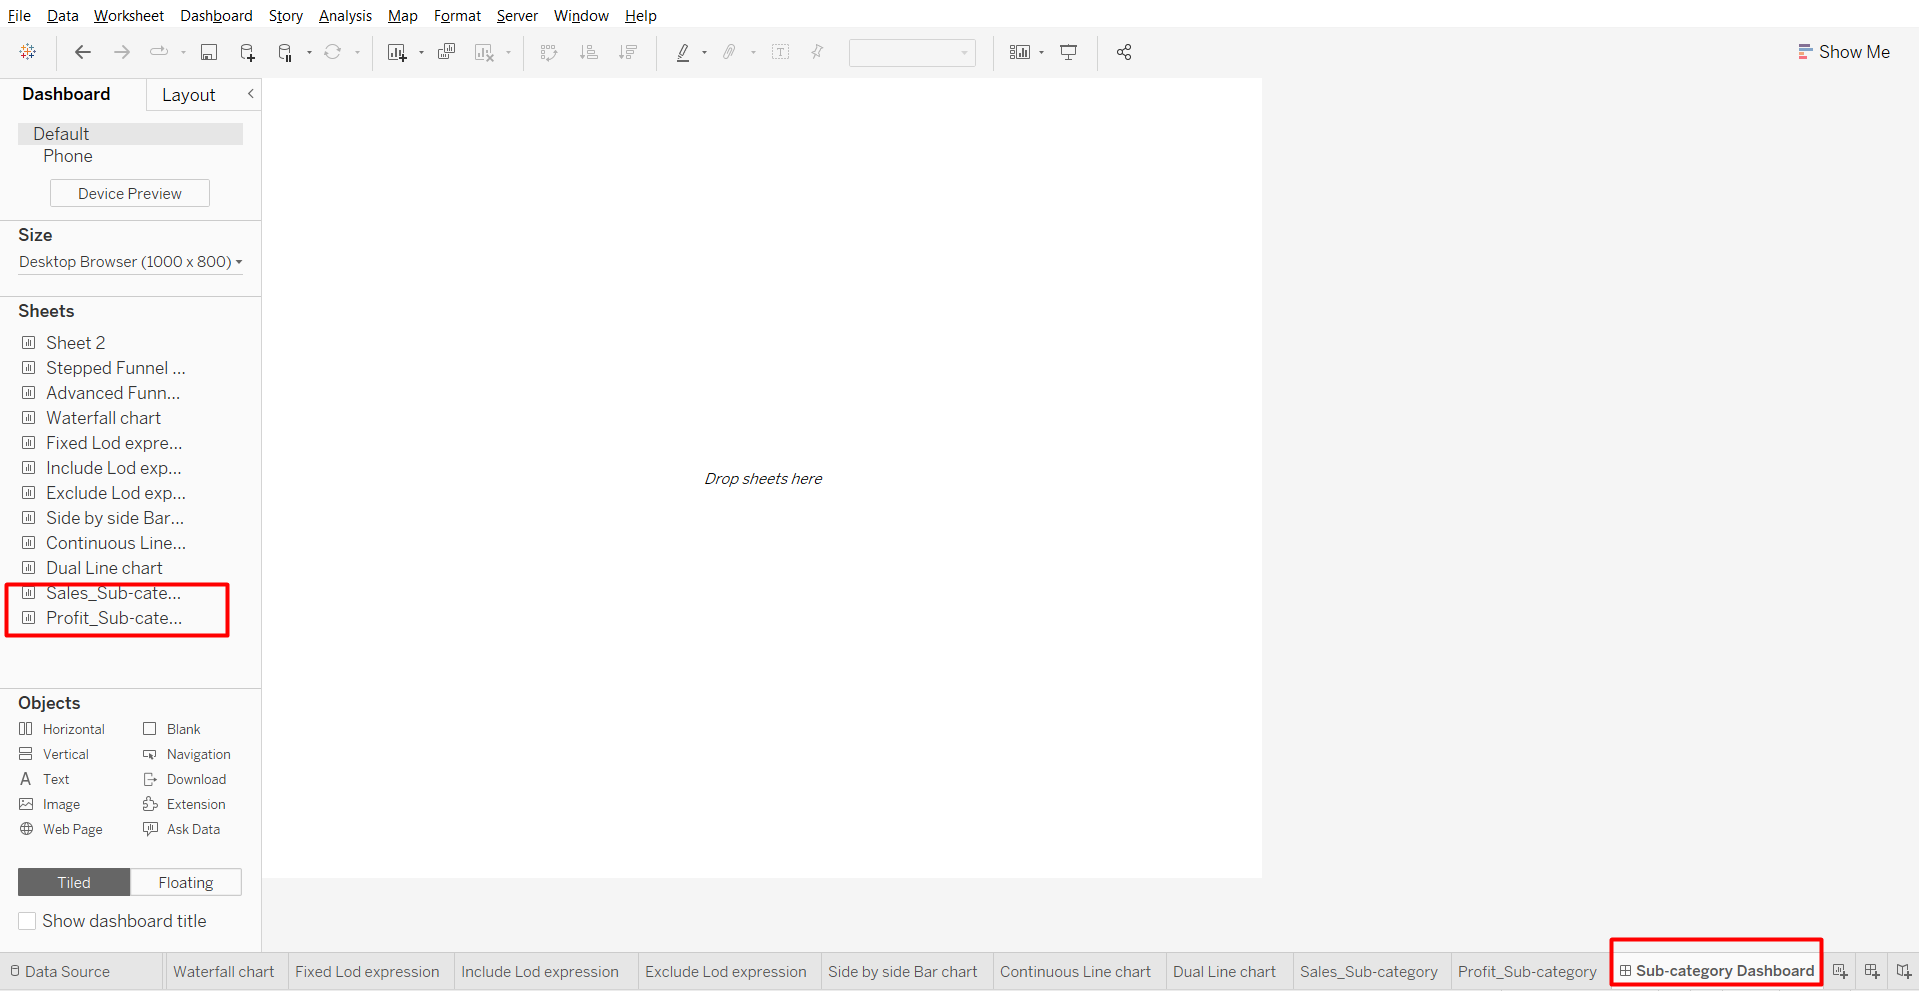
- Next, by clicking the Create New Dashboard icon at the bottom next to the sheet icon of the workbook. Right-click and rename the dashboard as Sub-Category Dashboard.
- Drag the two worksheets to the dashboard that we want in the view.
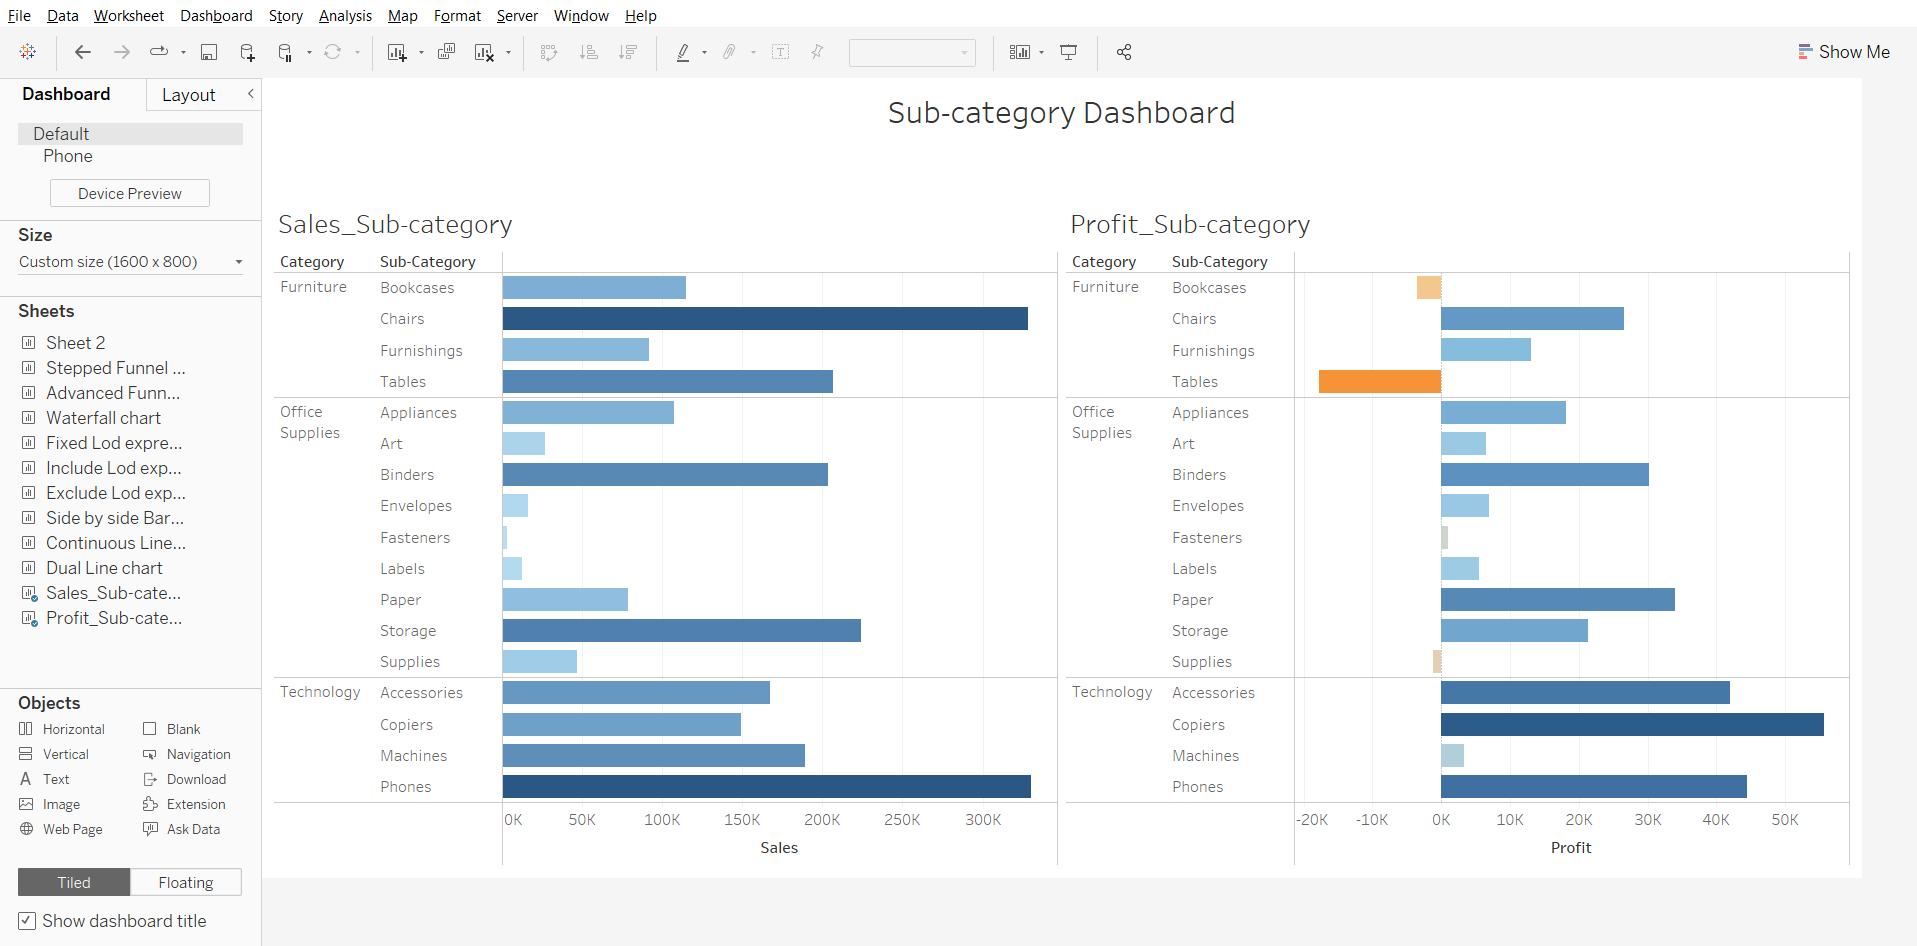
There are many other options featured in the dashboard that we can use can create more effective dashboards.
Follow us on Twitter, Facebook, Linkedin, and Tableau Public to stay updated with our latest blog and what’s new in Tableau.